This post was written by
Steve Hannah
, one of the newest additions to the Codename One team and a long time community contributor.
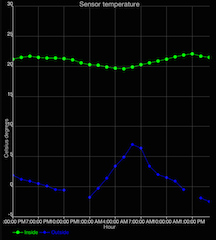
The upcoming update to Codename One will include a new package (com.codename1.charts) for rendering charts in your applications. This includes models and renderers for many common classes of charts including many flavours of bar charts, line charts, scatter charts, and pie charts.
**
Goals
**
For the charts package, we wanted to enable Codename One developers to add charts and visualizations to their apps without having to include external libraries or embedding web views. We also wanted to harness the new features in the graphics pipeline to maximize performance.
Differences from CN1aChartEngine
This package is based on the existing
CN1aChartEngine library
, but has been refactored substantially to reduce its size, improve its performance, and simplify its API. If you have used the existing CN1aChartEngine library, much of the API (e.g. models and renderers) will be familiar. The key differences are:
**
API
**
. It includes ChartComponent, a first-class Codename One Component that can be included anywhere inside your forms. CN1aChartEngine used a number of Android-like abstractions (e.g. View, Intent, and Activity) to simplify the porting process from the original Android library. While this indeed made it easier to port, it made the API a little bit confusing for Codename One development.
**
Performance
**
. It uses the built-in Codename One graphics pipeline for rendering all graphics. CN1aChartEngine used the CN1Pisces library for rendering graphics, which is an order of magnitude slower than the built-in pipeline. This was for historical reasons. When CN1aChartEngine was first developed, the built-in pipeline was missing some features necessary to implement charts.
- **
- Note
- **
_
Actually, just before refactoring CN1aChartEngine to produce the charts package, I ported it over to use the built-in pipeline. If you are already using CN1aChartEngine in your app, and want to benefit from the improved performance without having to change your code, you can update to
that version
.
_
**
Device Support
**
Since the charts package makes use of 2D transformations and shapes, it requires some of the new graphics features that are not yet available on all platforms. Currently the following platforms are supported:
Simulator
Android
iOS
If you require support for other platforms, you may want to use the
CN1aChartEngine
library instead.
**
Features
**
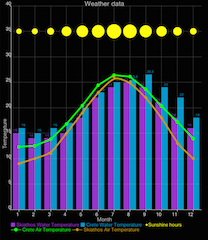
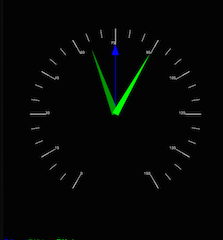
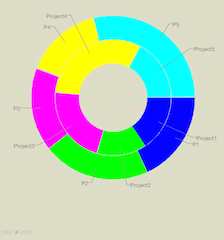
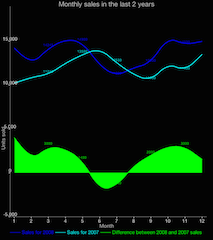
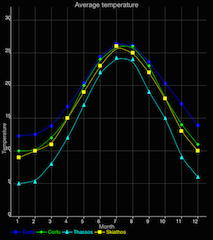
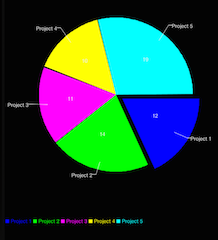
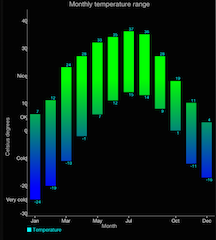
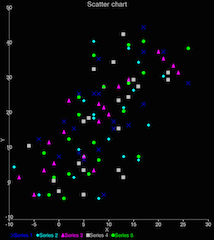
Built-in support for many common types of charts including bar charts, line charts, stacked charts, scatter charts, pie charts and more.
Pinch Zoom – The ChartComponent class includes optional pinch zoom support.
Panning Support – The ChartComponent class includes optional support for panning.
**
Chart Types
**
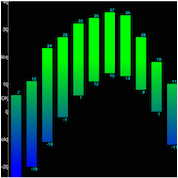
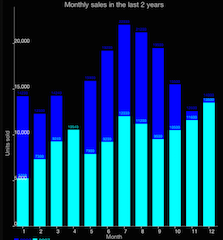
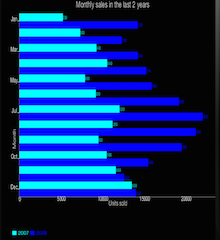
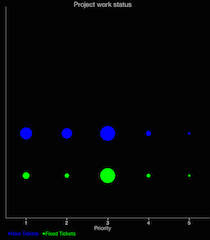
The com.codename1.charts package includes models and renderers for many different types of charts. It is also extensible so that you can add your own chart types if required. The following screen shots demonstrate a small sampling of the types of charts that can be created.
- **
- Note
- **
_
The above screenshots were taken from the ChartsDemo app. You can start playing with this app now by checking it out from our subversion repository.
_
**
How to Create A Chart
**
Adding a chart to your app involves four steps:
**
Build the model
**
. You can construct a model (aka data set) for the chart using one of the existing model classes in the com.codename1.charts.models package. Essentially, this is just where you add the data that you want to display.
**
Set up a renderer
**
. You can create a renderer for your chart using one of the existing renderer classes in the com.codename1.charts.renderers package. The renderer allows you to specify how the chart should look. E.g. the colors, fonts, styles, to use.
**
Create the Chart View
**
. Use one of the existing view classes in the com.codename1.charts.views package.
**
Create a ChartComponent
**
. In order to add your chart to the UI, you need to wrap it in a ChartComponent object.
You can check out the
ChartsDemo
app for specific examples, but here is a high level view of some code that creates a Pie Chart.
Notice: This post was automatically converted using a script from an older blogging system. Some elements might not have come out as intended…. If that is the case please let us know via the comments section below.
Archived Comments
This post was automatically migrated from the legacy Codename One blog. The original comments are preserved below for historical context. New discussion happens in the Discussion section.
Anonymous — February 5, 2015 at 2:46 am (permalink)
Anonymous says:
this is a great addition to the product. Are the charts clickable .. can i drill down? like if i want to drill down into a particular pie in the pie chart and render some other detail, can i do so ?
Anonymous — February 6, 2015 at 2:07 am (permalink)
Anonymous says:
The charts are clickable just like any component in Codename One. You can enable pinch zoom and panning by enabling flags on the component. In addition, you can derive the component and override the seriesPressed() and/or seriesReleased() methods to handle clicks on particular series in the chart. These methods receive events that tell you what part of the series was interacted with.
If you wanted to create interactivity, you could use these events to modify the data model, then repaint the component. You could also use Codename One’s animation plumbing to do these things in a smooth transition.
I’ll be writing more about this in future posts. If there are particular things you’d like to see in the posts, please let me know and I’ll try to incorporate them.
Steve
Anonymous — February 6, 2015 at 6:02 pm (permalink)
Anonymous says:
Can we use these library file in Intellij also ? Is so, do I have to just put them in the lib folder of the project ?
Anonymous — February 6, 2015 at 6:13 pm (permalink)
Anonymous says:
The new charts API is part of the codename one core. No need for libraries. The old chart engine libraries will work in IntelliJ also. Yes just place the cn1lib files in your lib directory and select “Refresh libs”.
manezi — May 18, 2015 at 9:56 am (permalink)
manezi says:
Thanks for the great work. Is additional platform support likely to be offered any time soon for com.codename1.charts? Or are platform limitations preventing this?
Shai Almog — May 18, 2015 at 3:28 pm (permalink)
Shai Almog says:
It also works on the JavaScript port now.
Which platforms are you interested in?
It works on all of our supported platforms except for J2ME, RIM and Windows Phone. J2ME & RIM are pretty outdated and irrelevant by now. We will probably rewrite the Windows work on top of their upcoming Android support at which point we we will have full support for charts.
Sana Maghraoui — December 24, 2016 at 9:32 am (permalink)
Sana Maghraoui says:
hello! I’m trying to do run this charts but I’m not able can u help me please?
Shai Almog — December 25, 2016 at 8:14 am (permalink)
Shai Almog says:
Hi,
what isn’t working?
Sana Maghraoui — December 25, 2016 at 5:15 pm (permalink)
Sana Maghraoui says:
hello!
I downloaded the project chart_master but it’s unrunnable
Shai Almog — December 26, 2016 at 5:06 am (permalink)
Shai Almog says:
It’s a bit hard to setup a new project for first timers. That’s why we have this demo in the new menu of intellij and NetBeans. Just create a new demo project and it should be one of the options.
Sana Maghraoui — December 26, 2016 at 8:37 am (permalink)
Sana Maghraoui says:
hi!
It’s okay I made it but It’s static can I make it dynamic?
Sana Maghraoui — December 26, 2016 at 1:57 pm (permalink)
Sana Maghraoui says:
hello I need to make dynamic charts can you help me?
Shai Almog — December 27, 2016 at 6:24 am (permalink)
Shai Almog says:
There is a dynamic chart in the demo as well as in the kitchen sink demo (under sales)
Sana Maghraoui — December 27, 2016 at 9:53 am (permalink)
Sana Maghraoui says:
I mean with dynamic that get information from the DataBase and display it
Sana Maghraoui — December 27, 2016 at 10:02 am (permalink)
Sana Maghraoui says:
*please help me I need to get information from the database and to display it
Shai Almog — December 28, 2016 at 1:23 pm (permalink)
Shai Almog says:
Kitchen sink gets information from a UI table, getting it from a database or a UI table is similar. External source that refreshes the table.
Sana Maghraoui — December 28, 2016 at 10:04 pm (permalink)
Sana Maghraoui says:
thank you for your replies but I can’t adapt the project to the one I working with I need help .I’m not finding the Myapplication .java in the kitchenSkin in the Demo so how can I do?thank you for your help
Shai Almog — December 29, 2016 at 5:51 am (permalink)
Shai Almog says:
Kitchen sink has files that are named differently (pretty much all apps/demos do), this specific demo has that code in the SalesDemo.
Jared Ruplinger — October 9, 2017 at 3:05 pm (permalink)
Jared Ruplinger says:
For those who are having trouble following the examples in the demo linked from this post, you might want to check out the “newer” demo from the post at https://www.codenameone.com…
It is a smidge simpler. That aside, however, there are a lot of moving pieces to the charts functionality and it would sure be nice to have some more thorough documentation.
Shai Almog — October 10, 2017 at 4:40 am (permalink)
Shai Almog says:
Yes, I agree. We need simpler charts. We added some simpler code into the kitchen sink under the sales demo. It tries to demonstrate a more “real world” use case.
Discussion
Join the conversation via GitHub Discussions.