The charts demo is one of the most elaborate/messy demos we have as it was derived/ported from an
aChartEngine demo. Since the
Codename One charts
are themselves a derivative of aChartEngine this makes a lot of sense but the demo is a bit big and hard to
follow.
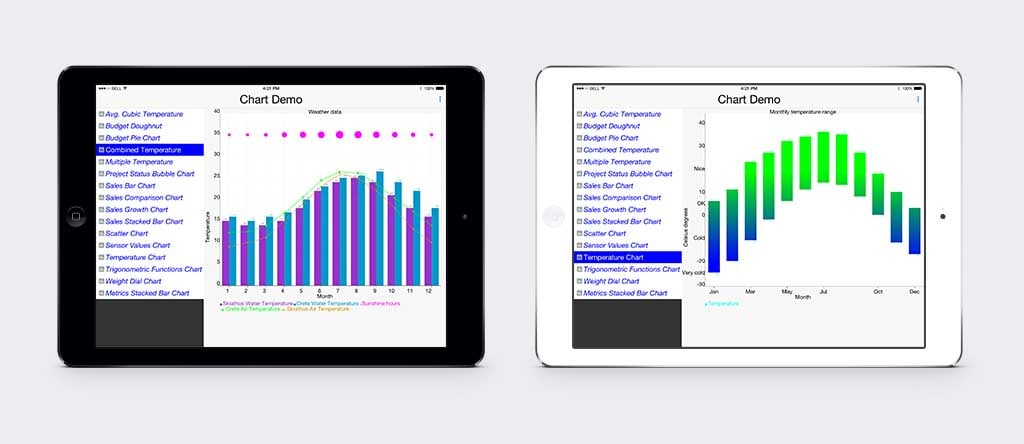
However, it does show off a lot of the chart types that can be created using the charts package. As such it is a
very valuable demo…
We’d love to modernize it more but time constraints make this impractical, for now we did the following:
Added a new tablet mode which makes the demo look completely different on the tablet using its screen dimensions
properlyStreamlined the colors/fonts – a lot of the charts were inconsistent and had really tiny/unreadable fonts
Switched to Toolbar – while we don’t make extensive use of this API in the demo it’s now the base API
Migrated the code to Java 8 syntax – we didn’t do it for every case where it could be used but the project
is now a Java 8 projectAdded pinch/pan to all the charts – this uses the builtin API in the
ChartComponentclassAdded some experimental features (e.g. chart editing) which are turned off by default at the moment. These were
half baked and getting this to work across all the charts and with all the features would have been challenging
Check out a live preview of the demo on the right here thanks to our JavaScript port!
The preview works in the mobile phone mode, to see this running in the tablet mode just open
this link and it will run in desktop/tablet mode.
Things like pinch to zoom don’t work in the JavaScript port for some reason but they should work reasonably
well on the device.
The Source
Check out the full source code for the demo in the
github repository for the Charts demo.
This demo will be integrated into the upcoming new project wizards in the various IDEs.
Discussion
Join the conversation via GitHub Discussions.