
I’ve been working on improved learning materials for Codename One. One of the problems with videos is that I can sometimes unintentionally drag an idea that can be explained with a single image. DPI is one of those ideas, I’m assuming most of you already understand it but even if you do, I think this graphic helps put things in perspective.
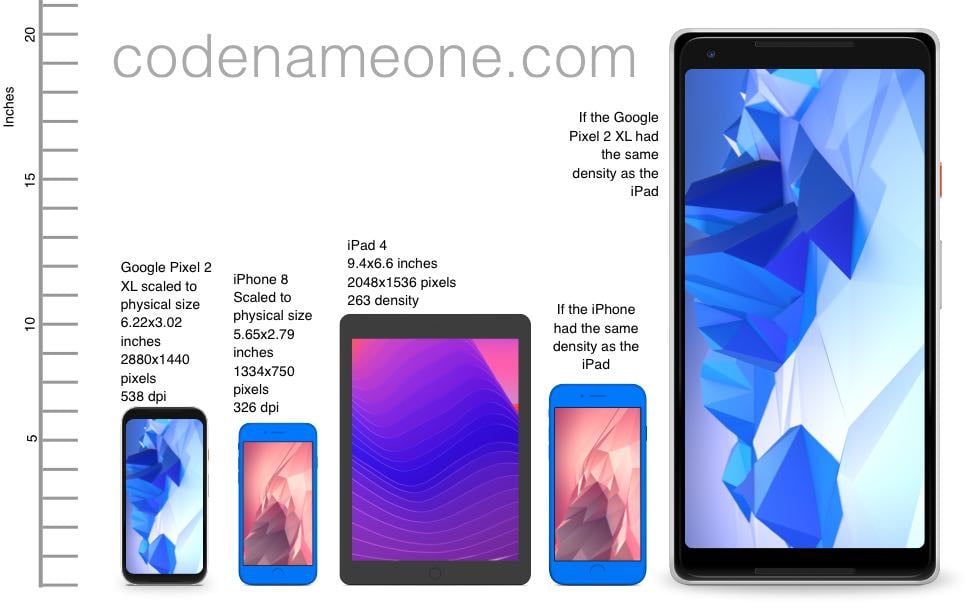
Figure 1. Device Density Explained in One Image
Archived Comments
This post was automatically migrated from the legacy Codename One blog. The original comments are preserved below for historical context. New discussion happens in the Discussion section.
maxii123 — April 11, 2018 at 11:30 am (permalink)
I think you need to step back and re-evaluate. That picture explains nothing. And I’m a professional programmer well versed in dpi and scaling issues. That’s just a lot of figures that only mean anything if you already understand it.
Shai Almog — April 11, 2018 at 1:11 pm (permalink)
Shai Almog says:
Thanks for the feedback. How would you improve that graphic?
The target audience for this graphic are programmers who have no experience in mobile. I just want to help visualize the density issue, not the solutions which would require a different graphic.
Discussion
Join the conversation via GitHub Discussions.