Table of Contents
- What does the GeoViz Library do?
- What is GeoJSON?
- GeoVizComponent vs MapComponent vs Native Maps
- Key Features
- Basic Usage
- Step One: Load the GeoJSON file
- Step Two: Create the GeoVizComponent
- Implementing a Custom Painter
I attended a tutorial at OSCON last year on HTML5 graphics where I was introduced to some cool data-visualization technologies. One thing that left an impression was the in GeoJSON format, which we used to generate some maps inside the browser using the D3 library and SVG. This was around the time that I was working on the new Codename One graphics pipeline, so at each step of the tutorial my inner commentator was whispering “we could do this in Codename One without too much difficulty”.
Fast forward 6 months, and the new graphics pipeline is complete, so I thought, why not try implementing some of those cool GeoViz features in Codename One. We have all the pieces in place? So I present the Codename One GeoViz library.
What does the GeoViz Library do?
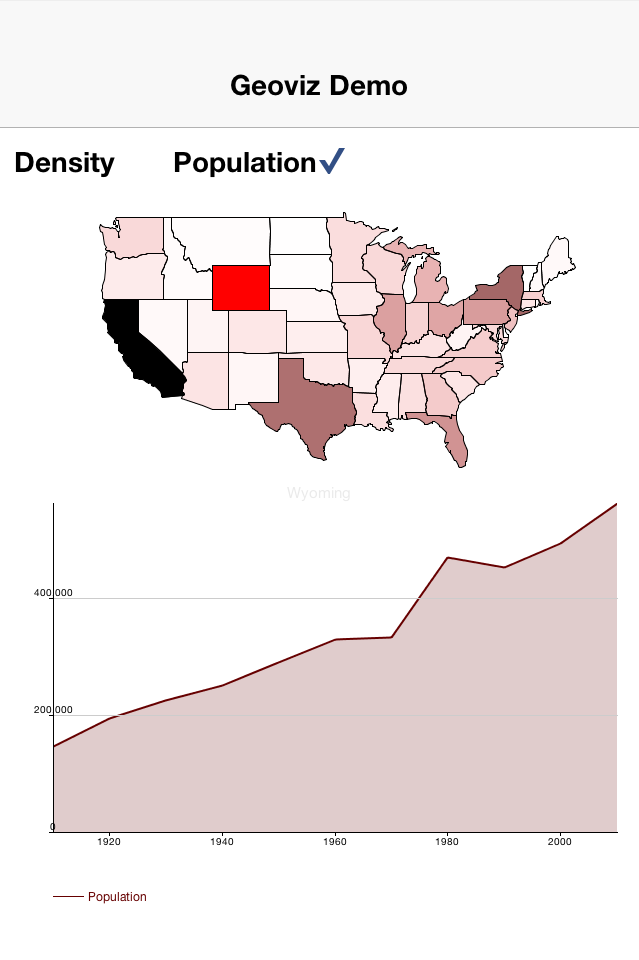
The GeoViz library allows you to load geographic data in GeoJSON format, and render it visually in your app. Below is a map of the USA that was rendered using this library.
What is GeoJSON?
GeoJSON is a standard format for storing geographic data in JSON format. A GeoJSON file may store a number of “features” which may include shape coordinates as well as information associated with the feature. For example, in the USA Map example, each state is a “feature” that includes shape coordinates for its contour, as well as property information such as the state name.
One of the nice things about GeoJSON is that it is already widely used and there are lots of existing free data sources (e.g. this GitHub Repo) where you can obtain state, country, city, etc… outlines that can now be easily included in your applications.
GeoVizComponent vs MapComponent vs Native Maps
Codename One already had two mechanisms for displaying maps: the MapComponent and the Native Maps library. Their purpose is different than the GeoVizComponent. Some key differences include:
The MapComponent uses a “tile”-based approach where it downloads tile images from a map server (e.g. Open Streetmaps or Google Maps). The GeoVizComponent renders geographic “shapes” that are stored as vectors so they can be rendered at any size, and transformed in any way you like without pixelization.
The MapComponent displays only maps as they are provided by the specified Map server. The GeoVizComponent will render any geographic information that can be expressed in a GeoJSON file. This might include a map of a building only, or a sparse map that only includes some key landmarks, or anything else you like.
Key Features
Pan and zoom. The component optionally supports pinch zoom and panning by dragging with your finger. You can also programmatically set the center point and zoom level, and animate the transition to the new viewport settings.
Custom painter support. You can implement your own painters to customize how features of the map are rendered. E.g. you can change the background color or different regions based on the data in associated data sets.
FeaturePressed/Released Events. You can detect touches to features of the map and respond to them accordingly.
Basic Usage
Step One: Load the GeoJSON file
GeoJSONLoader loader = new GeoJSONLoader();
FeatureCollection coll = loader.loadJSON(
        Display.getInstance().getResourceAsStream(null, "/us-states.json"),
        "UTF-8"
);
This example loads the us-states JSON file from the app resources using the GeoJSONLoader class.
Step Two: Create the GeoVizComponent
GeoVizComponent comp = new GeoVizComponent(coll);
Implementing a Custom Painter
The default painter will just render the map with black outlines and white fills. If you want to customize this you can install your own custom FeaturePainter. The following is an example custom painter taken from the GeoViz demo:
// Add a custom feature painter so that we can paint states different
// colors depending on the data in our CSV file.
comp.setFeaturePainter(new FeaturePainter(){

    /**
     * Callback to fill a feature (State).  We implement this
     * so that we can fill selected states with red and other states
     * a color based on the currently selected year.
     * @param g The graphics context
     * @param feature The feature to paint
     * @param path The shape that is to be filled.
     */
    @Override
    protected void fill(Graphics g, Feature feature, GeneralPath path) {

        int oldColor = this.getFillColor();
        int oldAlpha = this.getFillAlpha();
        if (feature == selectedFeature){
            this.setFillColor(0xff0000);
        } else {
            RegionData[] regionData = popData.getRegionData(
                (String)feature.getProperties().get("name")
            );
            if (currentYear > 0){
                if (mode==MODE_POPULATION){
                    for (RegionData d : regionData){
                        if (d.year == currentYear){
                            if (d.pop != 0){
                                this.setFillColor(
                                getColor(1.0, 0, 0, d.pop, minPopulation, maxPopulation));
                                this.setFillAlpha(getAlpha(d.pop, minPopulation, maxPopulation));
                            }
                            break;
                        }
                    }
                } else if (mode==MODE_DENSITY){
                    for (RegionData d : regionData){
                        if (d.year == currentYear){
                            if (d.density != 0){
                                this.setFillColor(getColor(0, 1.0, 0, d.density, minDensity, maxDensity));
                                this.setFillAlpha(getAlpha(d.density, minDensity, maxDensity));
                            }
                            break;
                        }
                    }
                }
            }
        }
        super.fill(g, feature, path);
        this.setFillColor(oldColor);
        this.setFillAlpha(oldAlpha);
    }

});
For the full example, check out the GeoViz Demo.
You can also check out the Javadocs for the library here.
Archived Comments
This post was automatically migrated from the legacy Codename One blog. The original comments are preserved below for historical context. New discussion happens in the Discussion section.
ftp27 — March 25, 2015 at 10:27 am (permalink)
Yesterday I’m solved a similar task 🙂
Chidiebere Okwudire — March 18, 2017 at 11:57 pm (permalink)
Chidiebere Okwudire says:
Hi, nice! I want to do something but I’m wondering how best to convert my map (in this case an office floor map) into GeoJSON so that users can click on specific, predefined areas to designate their office spaces. Any pointers?
Chidiebere Okwudire — March 19, 2017 at 12:05 am (permalink)
Chidiebere Okwudire says:
@Steve: Demo link still points to the now extinct googlecode repo. Can you update it to point to Github?
Shai Almog — March 19, 2017 at 5:12 am (permalink)
Shai Almog says:
We moved the demo repo here: https://github.com/codename…
We probably need to refresh that demo
Chidiebere Okwudire — March 25, 2017 at 10:30 pm (permalink)
Chidiebere Okwudire says:
Any idea if/how I can apply this concept to an arbitrary image? Use case is a floor map in which I want to define sitting positions such that users can click and indicate where they’re sitting for example. User ‘ftp27’ seems to have done something similar but I don’t know how…
shannah78 — March 31, 2017 at 1:26 pm (permalink)
shannah78 says:
I’m not sure the best way to do this. It depends on what data you already have about your floor plan. E.g. Do you have the lat/lng coordinates of all office spaces? How big is the floor plan? If you don’t have the coordinates, it might be just as easy to create some sort of “hot” map to make certain areas clickable. There might be specific tools for doing a job like this, but in the worst case, I might just open my floor plan in photoshop, then create a new layer for each clickable office space and draw a rectangle of some sort on that layer over the corresponding office space. You could probably then export the layers in a way that you could feed into your app.
I’ve never had to perform this task though so there may be better ways.
Chidiebere Okwudire — April 2, 2017 at 3:28 pm (permalink)
Chidiebere Okwudire says:
All I have is a high-res jpeg. I’ve read a bit more about GeoViz and it indeed appears to be for geospatial data and not arbitrary images.
It’s pretty easy for me to determine the pixels coordinates of the polygons bounding the desired spaces. However, given the different DPIs on various devices, I doubt this will work… What coordinates are provided in the pointerPressed(), pointerReleased() methods of the ImageViewer class? I’m wondering if I can map these in a DPI-independent way…
Shai Almog — April 2, 2017 at 5:03 pm (permalink)
Shai Almog says:
You can just scale both images together and use getRGB to get the pixel data of the color map.
You could use ImageViewer or just do something similar, check out its code.
Chidiebere Okwudire — April 5, 2017 at 3:05 am (permalink)
Chidiebere Okwudire says:
I’m not sure I completely get it: How does getRGB help in this case? On the original image, I define the coordinates of the bounding boxes of areas of interest. My challenge is how to translate these to the scaled image regardless of device DPI such that I can detect clicks within those areas and do other things like draw overlays.
Shai Almog — April 5, 2017 at 4:32 am (permalink)
Shai Almog says:
I don’t see the problem. You can just draw the image in any resolution you want.
Chidiebere Okwudire — April 5, 2017 at 5:41 am (permalink)
Chidiebere Okwudire says:
Okay. I’ll try it out and let you know if I run into any difficulties 😉
Discussion
Join the conversation via GitHub Discussions.