
One of the hardest ideas for developers to grasp in Codename One (or GUI programming in general) is the idea of a single event dispatch thread (EDT). The rules of using it and releasing it are sometimes complex and mistakes are very easy to make e.g.:
- Writing complex/slow code that blocks the EDT thus slowing the entire application
- Accessing Codename One widgets from a thread that isn’t the EDT.
The problem is that both of these issues are notoriously hard to catch on the simulator but often crop up on the device where race conditions can happen more easily and slow EDT performance is more noticeable.
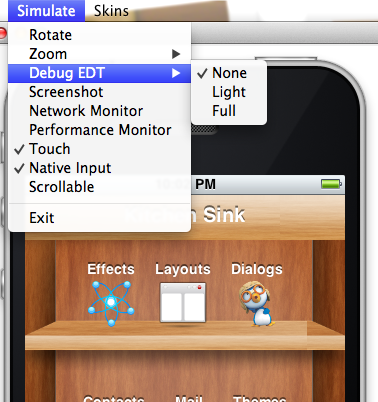
To ease the process of detecting these violations we added a flag to the simulator allowing you to receive information about such cases. When using light debugging you will see printouts to the console when accessing the EDT from a separate thread or taking too long to perform the task on the EDT. When setting it to full you will also see the stack trace where the violation was detected.
These tools aren’t perfect and they sometimes print out warnings that are unwarranted while entirely missing a real violation. However they can be a valuable tool in improving your application’s portability and responsiveness on multiple devices when used consciously.
Notice: This post was automatically converted using a script from an older blogging system. Some elements might not have come out as intended…. If that is the case please let us know via the comments section below.
Discussion
Join the conversation via GitHub Discussions.