We have added support for IntelliJ’s asynchronous code debugging feature, so that you can more easily debug your asynchronous code.
When debugging your apps in IntelliJ, stack-traces will include the “async” context’s stack frames so that you can see the stack trace of the code that scheduled your asynchronous code. For example, methods like callSerially() are notoriously prickly to debug because the “logical” stack trace includes the stack frame in which callSerially(Runnable) is called, and also the frame in which the Runnable‘s run() method is called. It is very difficult to walk up this “logical” stack from a break-point inside the run() method.
To demonstrate this point, consider the following code:
					package com.codenameone.devmode;

import com.codename1.ui.Button;
import com.codename1.ui.Form;
import com.codename1.ui.events.ActionEvent;
import com.codename1.ui.layouts.BorderLayout;

import static com.codename1.ui.CN.callSerially;

public class TestAsyncDebugForm extends Form {

    public TestAsyncDebugForm() {
        super(new BorderLayout(BorderLayout.CENTER_BEHAVIOR_CENTER_ABSOLUTE));
        Button btn = new Button("Hello 1");
        btn.addActionListener(this::button1Clicked);
        Button btn2 = new Button("Hello 2");
        btn2.addActionListener(this::button2Clicked);
        add(BorderLayout.CENTER, btn);
        add(BorderLayout.SOUTH, btn2);
    }

    private void button1Clicked(ActionEvent evt) {
        callSerially(printHello);
    }

    private void button2Clicked(ActionEvent evt) {
        callSerially(printHello);
    }

    Runnable printHello = () -> {
        printHello();
    };

    private void printHello() {
        System.out.println("Hello");
    }
}
This creates a form with two buttons: “Hello 1” and “Hello 2”. Clicking on either button will ultimately trigger an async call to the printHello() method, but they follow different code paths to get there. Clicking “Hello 1” triggers the button1Clicked() method, and clicking “Hello 2” triggers the button2Clicked() method – both triggering an async call to printHello().
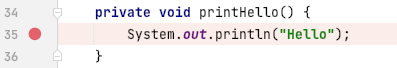
Let’s set a break point inside the printHello() method:
If we debug the app and press “Hello 1”, we will see a stack trace like the following:
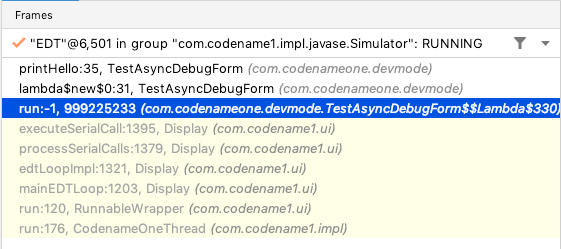
There is no way to tell from this stack trace which button was pressed to trigger it. If we walk up the stack we hit a dead end at executeSerialCall(). This is because the break-point occurs in the asynchronous callback of callSerially(), so the original stack frame for the call to callSerially() is already “gone” by the time we hit our break-point.
Now, let’s try this again with async debugging enabled. The stack trace this time will look like:
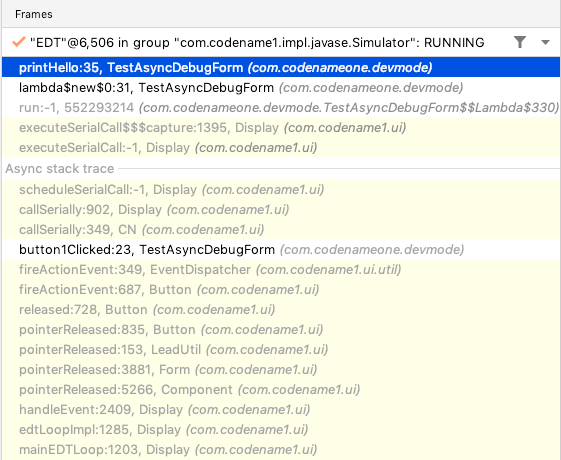
We can now trace this break-point back to “Button 1” definitively because it displays both the “execution” stack frame’s trace, and the scheduler’s stack frame’s trace.
Enabling Async Debugging
Async debugging requires:
That you are using IntelliJ IDEA
That your project is using Maven
That your
cn1.versionproperty is set to 7.0.65 or higher.That your project is configured to use the
com.codename1.annotations.Asyncannotations for the async stack traces feature. All projects created using the Codename One initializr after April 18th will include this configuration “out of the box”, so it should “just work”.
Configuring the Async Annotations
As mentioned above, new projects created with Codename One initializr after April 18th, should include async stack traces out of the box. If you have an existing project on which you want to enable async traces, you just need to tell IntelliJ to use the Codename One annotations for async stack traces. The easiest way is to simply copy the debugger.xml file from the cn1app-archetype into the .idea directory of your project.
Place the following into the .idea/debugger.xml file of your project to enable async stack-traces.
xml version="1.0" encoding="UTF-8"?
Alternatively you can follow the IntelliJ documentation for configuring custom annotations here. You should add com.codename1.annotations.Async.Schedule to the list of Async Schedule annotations, and com.codename1.annotations.Async.Execute to the list of Async Execute annotations. The configuration dialog is shown below.
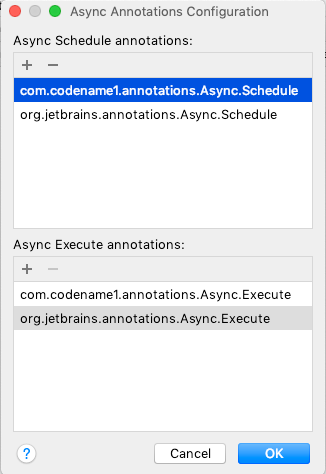
Figure 1. The Async Annotations configuration dialog in IntelliJ.
For More Information
For more information about IntelliJ’s asynchronous debugging feature, see the IntelliJ documentation on the subject.
Archived Comments
This post was automatically migrated from the legacy Codename One blog. The original comments are preserved here for historical context. New discussion happens in the Discussion section below.
Antonio Rios — April 14, 2022 at 3:20 am (permalink)
Antonio Rios says:
Wonderful new features! Great job guys! I’m literally impress every time I visit the blog and see some new cool feature added. Keep those cool useful features coming please.
Discussion
Join the conversation via GitHub Discussions.