Performance & Network Monitors
Quick introduction to builtin tools in the Codename One simulator
Using The Network Monitor
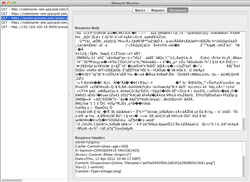
While the Network Monitor Eric wrote about is a quite powerful tool, it does have some complexities and doesn’t display all the internal post operations for some cases. To solve that issue we created a network monitor tool which is integrated with the simulator and provides a one click tool to view network activity easily.
The tool is really simple to use, just open it from the Simulator window and it will load with all instances of the simulator until its explicitly closed.
You can view all the details you would expect about every network request/response sent to/from your simulator by selecting from the list to your left.
Using The Performance Monitor
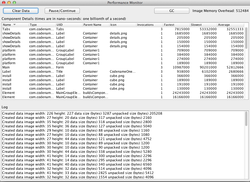
NetBeans ships with a powerful profiler and there are quite a few excellent profilers that can give you allot of information about application execution. However, while a profiler will inform you of slow methods it will not inform you of slow components. Since the Codename One code is very generic you will see performance issues as slow EDT/Components within the profiler even if only one specific component is slow.
The performance monitor shows you the time (in nano seconds = billionth of a second) it takes to render a component and which components get painted the most. It also informs you about memory overhead (relevant also for GC activity) and occurrences that could be interesting to you when debugging performance issues. This tool is designed to help you investigate slow performance feel of an application by understanding what is actually happening within your application.