Reducing resource file size
It’s easy to lose track of size/performance when you’re working within the comforts of a visual tool like the Codename One Designer. When optimizing resource files you need to keep in mind one thing: it’s all about image sizes.
Like every optimization the first rule is to reduce the size of the biggest images which will provide your biggest improvements, for this purpose Codename One provides the ability to see image sizes in kilobytes. To launch that feature use the menu item Images → Image Sizes (KB) in the designer.
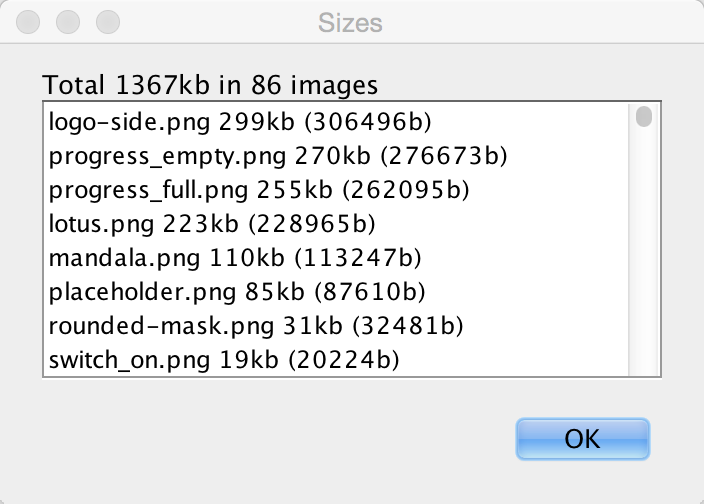
This produces a list of images sorted by size with their sizes. Often the top entries will be multi-images, which include HD resolution values that can be pretty large. These high-resolution images take up a significant amount of space!
Just going to the multi-images, selecting the unnecessary resolutions & deleting these images can save significant amounts of space:
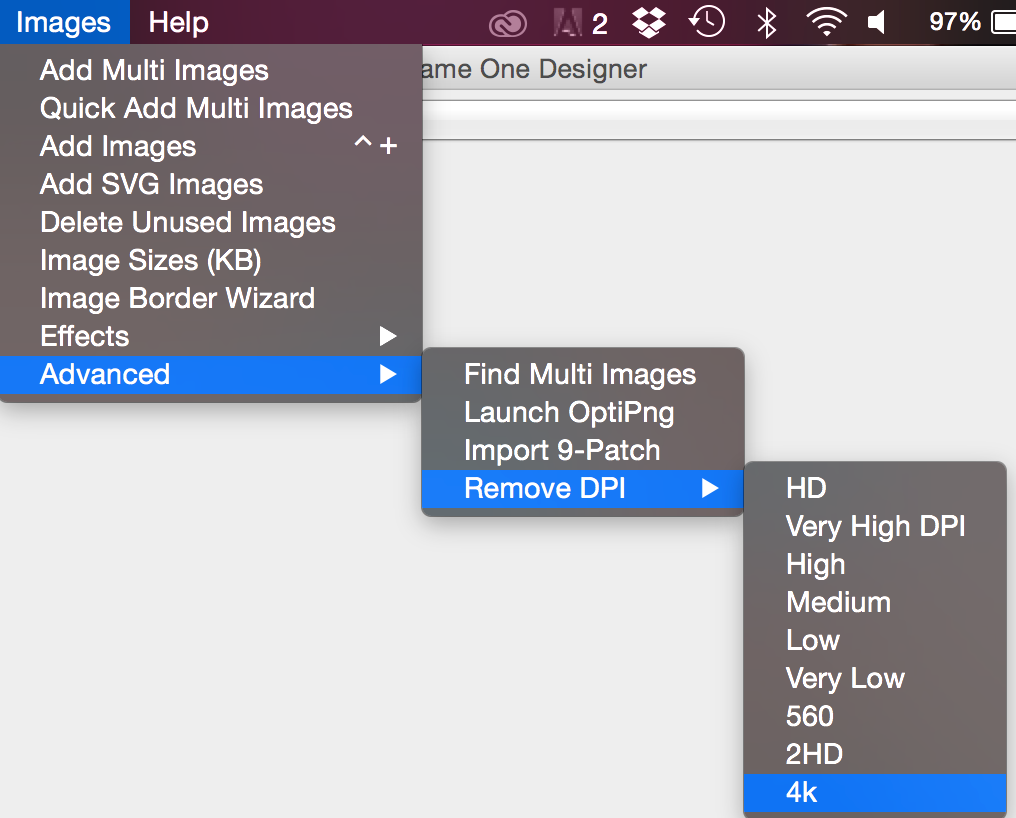
Applications using the old GUI builder can use the Images → Delete Unused Images menu option (it’s also under the Images menu). This tool allows detecting and deleting images that aren’t used within the theme/GUI.
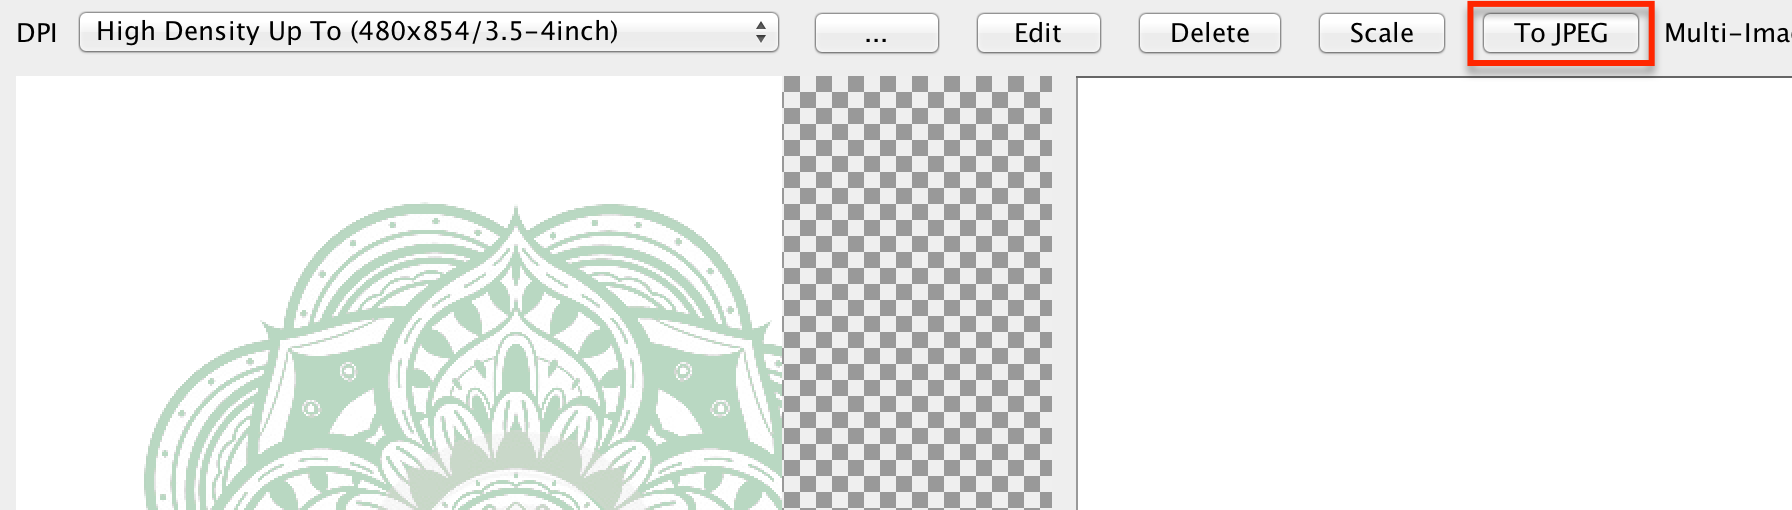
If you have a large image that’s opaque you might want to consider converting it to JPEG and replacing the built in PNG’s. Notice that JPEGs work on all supported devices and are typically smaller.
You can use the excellent OptiPng tool to optimize image files right from the Codename One designer. To use this feature you need to install OptiPng then select Images → Launch OptiPng from the menu. Once you do that the tool will automatically optimize all your PNG’s.
When faced with size issues make sure to check the size of your res file, if your JAR file is large open it with a tool such as 7-zip and sort elements by size. Start reviewing which element justifies the size overhead.
Improving performance
As a developer you can do quite a few things to improve the performance and memory footprint of a Codename One application. This sometimes depends on specific device behaviors but some tips here are true for all devices.
The simulator contains some tools to measure performance overhead of a specific component and also detect EDT blocking logic. Other than that follow these guidelines to create more performance code:
Avoid round rect borders - they have a huge overhead on all platforms. Use image borders instead (counter intuitively they’re MUCH faster)
Avoid Gradients - they perform poorly on most OSes. Use a background image instead
Use larger images when tiling or building image borders, using a 1 pixel (or event a few pixels) wide or high image and tiling it repeatedly can be expensive
Shrink resource file sizes - Otherwise data might get collected by the garbage collector and reloading data might be expensive
Check that you don’t have too many image lock misses - this is discussed in the graphics section
On some platforms mutable images are slow - mutable images are images you can draw on (using
getGraphics()). On some platforms they perform quite badly (for example, iOS) and should be avoided. You can check if mutable images are fast in a platform usingDisplay.areMutableImagesFast()* Make components either transparent or opaque * - a translucent component must paint it’s parent every time. This can be expensive. An opaque component might have margins that would require that you paint the parent so there is often overdraw in such cases (overdraw means the same pixel being painted twice).
ParparVM native translation performance hints
For ParparVM-generated native code, Codename One now supports method-level optimization hints via annotations. These can provide good wins in hot code paths, but they come with tradeoffs and should be applied surgically.
Method-level codegen hints
@DisableDebugInfo
Suppresses generated line/debug metadata for the annotated method. This can reduce generated C size and remove some per-instruction debug overhead.@DisableNullChecksAndArrayBoundsChecks
Suppresses generated null and array-bounds checks for the annotated method. This can reduce branch-heavy code in tight loops.
Class-level concrete implementation hints
For native ParparVM output (C/Objective-C), you can also provide a class-level hint that a base type always maps to a known concrete subclass at runtime:
@Concrete(name="fully.qualified.ConcreteClassName")
Allows the translator to bypass virtual table lookup forinvokevirtualcalls on the annotated base class. The translator first attempts a direct call on the concrete class; if the method isn’t implemented there, it falls back to the annotated base class implementation.nameis the mapping for iOS and the default target. The native Windows, Linux and macOS builds readwin,linuxandmacinstead, and a target whose attribute is absent keeps ordinary virtual dispatch, so supply every target you ship.
This is useful for platform abstraction classes where one implementation is guaranteed in the native pipeline.
For example, Codename One annotates:
// Each target reads its own attribute: name() is the iOS and default
// mapping, and the native Windows, Linux and macOS builds read win(),
// linux() and mac(). A target whose attribute is absent simply skips
// the optimization, so all four are supplied here.
@Concrete(name = "com.codename1.impl.ios.IOSImplementation",
          win = "com.codename1.impl.windows.WindowsImplementation",
          linux = "com.codename1.impl.linux.LinuxImplementation",
          mac = "com.codename1.impl.mac.MacImplementation")
public abstract class CodenameOneImplementation {
    // ...
}
Fused object layout: @Fused
A class annotated @com.codename1.annotations.Fused tells the translator that
primitive arrays created in its constructors are fully encapsulated: they’re
implementation details the class never hands out. The translator then lays the
owner object and those arrays out in a single allocation block — one
allocation instead of several, one GC visit instead of several, and no
pointer indirection between the object and its buffer.
@com.codename1.annotations.Fused
class RgbImage {
    private final int[] pixels;   // laid out INSIDE the RgbImage allocation
    private final byte[] flags;
    RgbImage(int w, int h) {
        pixels = new int[w * h];  // computed sizes (w * h) fuse too
        flags = new byte[16];
    }
}
The contract you accept by annotating:
The fused arrays must never be stored into another object’s field, a static, or an array — their lifetime is the owner’s lifetime. Reading them, iterating them, and passing them as transient call arguments is fine.
Keep the fields private and never return them from a getter. If the class hands its buffer out, don’t annotate it.
Everything else stays automatic and safe: constructors that compute non-constant sizes, reflective instantiation, delegating constructors and oversized arrays (bigger than the small-object allocator handles) all fall back to ordinary separate allocations with identical semantics.
java.lang.String and java.lang.StringBuilder are fused this way
internally — a typical string is one allocation, not two.
Optimizations you get without annotations
Several ParparVM optimizations are applied automatically when the translator can prove they’re safe; knowing they exist helps you write code that benefits from them:
Stack-allocated string building. Every string concatenation the compiler lowers to a
StringBuilderchain — and any builder the translator can prove never escapes its method — is allocated on the C stack, including its initial character buffer. A typical"a" + x + "b"allocates nothing on the heap except the resultingString. This is proven per call site by escape analysis; passing the builder to another method or storing it in a field simply keeps that site on the ordinary heap path.Tagged integers. On 64-bit targets,
Integer.valueOfreturns a tagged immediate pointer instead of allocating — boxing anintfor a map key is free. 32-bit-pointer targets (including Apple Watch) fall back to heap boxing automatically.Closed-world devirtualization. A virtual call with no reachable override compiles to a direct C call, which link-time optimization can then inline.
finalclasses and methods make this trivially provable.Compact collections.
HashMap/LinkedHashMapuse open addressing over parallel arrays — no entry objects, no allocation onput,clear()is three array wipes.Bounds-check elimination. The canonical
for (int i = 0; i < arr.length; i++)loop shape is proven safe and compiled without per-access checks — prefer it over manual index juggling.
The benchmark and correctness suite that gates these optimizations lives in
vm/benchmarks in the repository, with run instructions in its README; every
optimization must produce output bit-identical to a host JVM there before it
ships.
Fast method-stack path
The translator can emit a fast method-stack prologue/epilogue (DEFINE_METHOD_STACK_FAST_* and CN1_FAST_RETURN_RELEASE) for methods that meet strict safety criteria. Methods that qualify for the stricter frameless form (no try/catch, no synchronization) skip the VM frame entirely — their locals become plain C locals the optimizer keeps in registers.
In practice, this tends to help for:
Small, hot methods.
Methods without monitor usage / exception-heavy flow.
Methods with straightforward control flow and low instruction complexity.
Tradeoffs:
Overly broad fast-path eligibility can regress performance if extra branches or memory writes are introduced.
Primitive- fast-frame variants may not always outperform a straightforward full clear on all targets/compilers.
Base64-style hot-loop guidelines
For low-level loops (for example, Base64 encode/decode):
Prefer simple loop bodies with predictable branches.
Cache decode/lookup tables in primitive arrays (
int[]lookup tables can reduce per-iteration conversion overhead).Avoid adding “defensive” branches in the inner-most loop unless they’re required for correctness in production inputs.
Build configuration matters
When benchmarking translator output, ensure native projects are compiled with optimization enabled (for example, CMake Release builds). Debug/default builds can hide improvements or produce misleading regressions.
If you’re using the integration test harness, make sure CMake is configured with:
-DCMAKE_BUILD_TYPE=Release
Without this setting, comparison between Java and ParparVM native output is often noisy and can lead to wrong optimization conclusions.
Profile-guided optimization
A C compiler optimizes without knowing which code your application runs. It guesses which branch of an if is the common one, which calls are worth inlining and which functions belong next to each other in the binary. Profile-guided optimization (PGO) replaces those guesses with measurements. The build server compiles your application twice:
The first compile produces an instrumented binary that counts how often every function and branch runs.
The build server launches that binary and lets it run for a training period. The counts it records are the profile.
The second compile reads the profile. Code that ran often is inlined and laid out for speed, and code that never ran is kept small and out of the way.
Only the second binary is delivered. The instrumented one never leaves the build server.
PGO is available for iOS, native macOS and native Linux builds. The translated Java code, the Codename One runtime and your native sources are all compiled with the profile.
When to use it
PGO is at its best on workloads that run the same code over and over, which is what a benchmark does. If you publish performance numbers for your application, or compare it against another toolchain, a profile-guided build shows it at its best. How much an ordinary application gains depends on how much of its time is spent in the code the training run exercised.
Codename One’s own benchmarks are built without PGO. A profile trained on the benchmark itself would skew the result, so the published numbers describe a regular build.
Enabling a profile-guided build
Each target has its own build hint, so turning PGO on for one target never changes the build of another:
| Build hint | Target | Where the training run happens |
|---|---|---|
| iOS | An iOS simulator that the build server creates for the run and deletes afterward |
| Native macOS | The build server itself |
| Native Linux | The build server itself, on a virtual display |
For example, to profile the iOS and macOS builds and give each run 90 seconds:
codename1.arg.ios.pgo=true
codename1.arg.macos.pgo=true
codename1.arg.pgo.trainingSeconds=90
pgo.trainingSeconds is shared by every target. It defaults to 60 seconds, and a value below 10 or above 300 is brought into that range.
The iOS and macOS hints and the training period are also available as build hint annotations: @Ios(pgo = Toggle.ON), @Mac(pgo = Toggle.ON) and @Build(pgoTrainingSeconds = 90). linux.pgo has no annotation and is set in codenameone_settings.properties.
Profile-guided builds are a Pro and Enterprise feature of the cloud build service. A local build doesn’t read these hints.
What the training run measures
Nobody touches the application during the training run. It starts, shows its first form and is then left alone until the training period ends, so the profile describes start-up and whatever the application does by itself after that: loading resources, laying out and painting the first screen, timers, animations and network requests it makes without being asked.
That has two practical consequences:
Work that only happens after a tap isn’t in the profile. The compiler treats that code as cold. It still runs correctly, but it gains nothing from the profile.
The application has to keep running for the whole period. An application that exits by itself or crashes during the run stops the build.
The build server isn’t one of your users' devices. A training run has no stored login and no saved data. Make sure the application reaches a representative screen from a clean install.
A profile-guided build never falls back
A build that asks for PGO either delivers a profiled binary or fails with a message that says why. It never delivers a binary built without the profile under the same name. The build stops when:
The hint has a value other than
trueorfalse, orpgo.trainingSecondsisn’t a whole number.The account isn’t on a Pro or Enterprise plan.
The application ends before the training period does, or is still running well after it.
The training run recorded no profile data.
The hint is combined with a setting that produces a binary the profile can’t apply to. The following table lists these.
| Build hint | Can’t be combined with |
|---|---|
|
|
|
|
| A |
The settings and the plan are checked before any compilation starts, so a request that can’t be honored fails within seconds.
A profile-guided build takes longer than a regular one. It adds a second compile, the training period, and the time to start and stop the simulator on iOS.
SIMD: Data-Parallel primitives
SIMD stands for Single Instruction, Multiple Data. It’s a family of CPU
instructions that apply the same arithmetic or logical operation to several
values at once, packed together into a single wide register. On a 128-bit
NEON or SSE register you can hold sixteen bytes, eight 16-bit integers, four
32-bit integers, or four 32-bit floats, and a single instruction such as
VADD or PADDD then operates on every lane in parallel. For data-parallel
workloads—Base64 encode/decode, pixel blending, alpha-mask compositing,
color-channel manipulation, table lookups—SIMD typically delivers a 3× to
10× speedup over scalar code.
Modern mobile and desktop CPUs expose several SIMD instruction sets:
x86/x64—MMX, SSE, SSE2/3/4, AVX, AVX2, AVX-512
ARM/ARM64—NEON (Advanced SIMD) and SVE
Codename One exposes those primitives as portable Java method calls on
com.codename1.util.Simd.
On ParparVM (iOS) the translator lowers them to NEON intrinsics; on Android
and the JavaSE simulator a pure-Java fallback in JavaSESimd provides the
same semantics so code written against Simd runs everywhere and simply
performs better where native SIMD is available.
When to use SIMD
SIMD is worth reaching for when all the following hold:
You are processing a buffer of at least dozens of elements at a time.
The operation per element is simple (add, min, blend, table lookup, interleave/unpack) and identical across elements.
Control flow is regular—no per-element early exit, no data-dependent branches that differ across lanes.
Data is contiguous in a primitive array (
byte[],int[],float[]).
Classic fits are image pixel passes, codecs (Base64, UTF-8 validation, hex encoding), checksums, audio mixing, and vector arithmetic. Poor fits are tight loops with pointer chasing, per-element branching on complex state, or buffers smaller than a single SIMD register.
If you aren’t sure whether your platform has a vectorized implementation
available, call Simd.get().isSupported(). The fallback path still returns
correct results; isSupported() only tells you whether you will see the
speedup.
Getting an instance
Simd is accessed as a singleton:
Simd simd = Simd.get(); // equivalent to CN.getSimd()
if (simd.isSupported()) {
    // native SIMD is wired up on this platform
}
The returned object is safe to cache in a field as long as the cache is refreshed across simulator restarts (the simulator may swap the backing implementation).
Allocation: Alignment and provenance
SIMD load/store instructions prefer—and on some architectures require—
that the memory address they read from or write to be a multiple of the
register width (16 bytes on NEON and SSE). Misaligned access either throws
a hardware fault on strict platforms or costs extra cycles because
the CPU has to split the transaction across two cache lines. A JVM offers
no guarantee that new byte[64] is aligned to anything beyond the
platform’s object-header convention, so the framework forbids passing
arbitrary new-allocated arrays to Simd primitives.
Every buffer used with a Simd primitive must so come from one of
the allocation helpers on Simd:
byte[]  bytes  = simd.allocByte(64);   // heap, 16-byte aligned, registered
int[]   ints   = simd.allocInt(32);    // heap, 16-byte aligned, registered
float[] floats = simd.allocFloat(32);  // heap, 16-byte aligned, registered
All three methods enforce a minimum size of 16 elements and throw
IllegalArgumentException for anything smaller; the minimum keeps each
buffer large enough to hold a full SIMD register and leaves room for
alignment padding.
new byte[64] and pass them
to Simd. The simulator enforces this at runtime (see Simulator
Tracking below) and the iOS native path assumes alignment. Passing an
unregistered array yields either an IllegalArgumentException in the
simulator or undefined results on device.A minimal End-to-End example
All Simd ops take explicit offset / length pairs so callers can
chunk a large buffer through a small scratch array without reallocating.
Many methods have interleaved variants—unpackBytesInterleaved3/4,
packBytesInterleaved3/4—designed for packed pixel formats (RGB, RGBA)
and fused operations like blendByMaskTestNonzero and
replaceTopByteFromUnsignedBytes that collapse common three- or
four-pass pixel pipelines into a single vector pass.
Scratch allocations: alloca*
A SIMD primitive often needs a short-lived working buffer: somewhere to
stage intermediate lanes, hold a temporary mask, or accumulate partial
results. Allocating a new byte[] per call via allocByte would dominate
the runtime of the primitive it was trying to accelerate—heap
allocation, zero-fill, and eventual GC reclamation all add up. The natural
solution is to let the compiler place these buffers on the call stack
where they cost nothing to create and are reclaimed automatically when the
method returns. This is what the alloca* family exposes:
byte[]  scratchB = simd.allocaByte(64);
int[]   scratchI = simd.allocaInt(32);
float[] scratchF = simd.allocaFloat(32);

// Deterministic initial contents:
byte[]  zeroed   = simd.allocaByteZeroed(64);
int[]   filled   = simd.allocaIntFilled(32, -1);
On the simulator (and on Android) these behave like heap allocations with
registration. On ParparVM the translator intercepts each alloca* call
and rewrites it into a C-level __builtin_alloca that carves a faux
JavaArrayPrototype out of the current C stack frame. The resulting
pointer masquerades as an ordinary Java array for the lifetime of the
enclosing method and is reclaimed on return.
The distinction between allocByte and allocaByte mirrors the
distinction between new byte[N] and C’s alloca(N):
alloc* (heap) | alloca* (stack on ParparVM) | |
|---|---|---|
Cost to assign | object header + zero fill + GC bookkeeping | register adjust, essentially free |
Lifetime | until last reference dropped | until enclosing method returns |
Can be stored in a field | yes | no—use-after-free on device |
Can be returned from the method | yes | no |
Can be passed to non- | yes | no |
Initial contents | zero | undefined (use |
Size limit | heap | bounded by remaining stack |
alloca* memory, like any stack memory, starts out containing
whatever the previous frame left behind. Callers that require predictable
initial contents should use allocaByteZeroed / allocaIntZeroed /
allocaFloatZeroed, or the *Filled variants that accept an explicit
initial value, rather than rolling their own loop.Rules for alloca* scratch arrays
Because alloca* memory can’t outlive its defining method on
ParparVM, the array it returns must be treated as method-local.
The framework enforces four rules at build and run time:
Don’t return an
alloca*array from the method that allocated it.Don’t store an
alloca*array in an instance or static field, or into an object array.Don’t pass an
alloca*array to a method whose owner isn’tSimd,IOSSimd, orJavaSESimd. Helper methods outside the SIMD package might themselves violate one of the other rules.Don’t pass an
alloca*array throughinvokedynamic; dynamic dispatch can’t be analyzed statically.
Inside the defining method you are free to pass the array to any number
of Simd primitives, copy values into and out of it, combine it with
other buffers, etc.
Build-Time verification
The Maven plugin ships a bytecode-compliance goal (compliance-check)
that walks every method in the application’s compiled classes and
performs a dataflow pass whose only job is to track whether each value
on the operand stack or in a local variable was produced by an alloca*
call. The pass is an ASM BasicInterpreter subclass that taints every
value returned from a method on Simd, IOSSimd, or JavaSESimd whose
name begins with alloca followed by an upper-case letter. The taint
propagates through DUP, ASTORE/ALOAD, CHECKCAST, and every
control-flow merge, so a value keeps its provenance through any amount
of local plumbing.
The verifier fails the build if a tainted value reaches any of:
ARETURN—"SIMD alloca value returned from method"PUTFIELD/PUTSTATIC—"SIMD alloca value stored into instance/static field"AASTORE—"SIMD alloca value stored into object array"INVOKE*whose owner isn’tSimd,IOSSimd, orJavaSESimdINVOKEDYNAMIC: refused unconditionally
Every violation is reported with the offending class, method, and the hint "Keep SIMD alloca scratch arrays method-local and only pass them to SIMD methods." Because this is wired into the Maven build, code that would dereference freed stack memory on device can’t ship.
A complementary guard lives inside the translator itself:
CustomInvoke.appendSimdAllocaExpression only performs stack lowering
when the length argument is a compile-time constant. A call like
simd.allocaByte(n) with a variable n falls through to the default
codegen and becomes a normal heap allocation, which avoids both
unbounded stack growth and an alloca whose size the translator can’t
inspect.
Simulator tracking of aligned arrays
The JavaSE simulator runs on the desktop where there is no NEON, no
__builtin_alloca, and no guarantee that a given byte[] is 16-byte
aligned. To keep developer bugs from hiding on the desktop and
reappearing only on device, the simulator takes a strict stance: only
arrays obtained from Simd.alloc / Simd.alloca* are accepted as
inputs to SIMD primitives.*
Internally this is an identity-based registry. Every allocation helper
routes its result through a registration call that stores the array’s
System.identityHashCode—the JVM’s per-object identity hash, stable
for the object’s lifetime regardless of GC movement. Every SIMD entry
point validates its array arguments against the same set and throws
IllegalArgumentException if a caller hands it a plain new byte[64]:
java.lang.IllegalArgumentException: SIMD array argument was not
allocated using Simd.alloc*(). objectId=…
Combined with the build-time verifier, both static analysis and dynamic execution refuse to accept arrays that would not be 16-byte aligned on device. On the device itself no such validation occurs—by that point the build has already proved the invariant.
Built-In SIMD paths
You gain from SIMD without touching the API directly.
com.codename1.util.Base64 detects Simd.isSupported() at encode/decode
entry points and routes the hot loop through unpackLookupBytesInterleaved4,
lookupBytes, or, and shl with cached per-call constant tables; the
bodies of Image.applyMask, Image.modifyAlpha, and Image.removeColor
use fused primitives like replaceTopByteFromUnsignedBytes and
blendByMaskTestNonzero to collapse multi-pass pixel pipelines into a
single vector loop.
If you are writing your own hot loop on a primitive buffer and the data
is already contiguous and aligned in a Simd.alloc* array, reach for the
Simd API before optimizing further with the ParparVM annotations
described above—vectorization and annotation hints compose, but
vectorization is the larger win.
Performance monitor
The Performance Monitor tool can be accessible via the Simulator → Performance Monitor menu option in the simulator. This launches the following UI that can help you improve application performance:
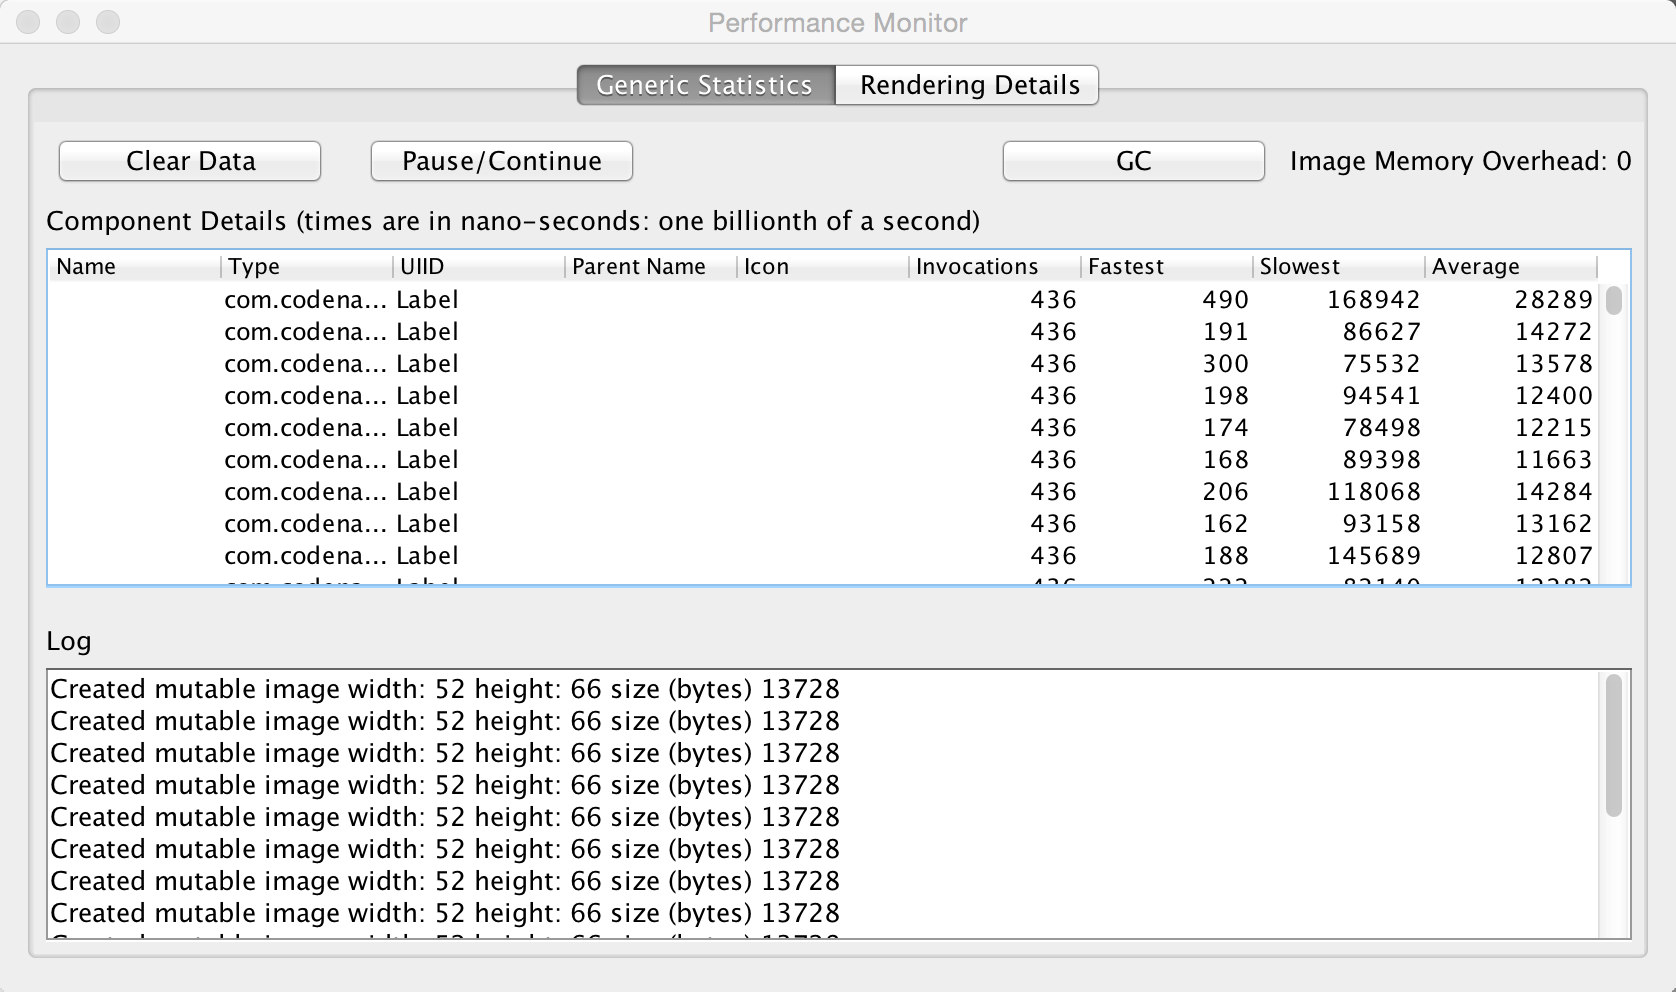
The first tab of the performance monitor includes a table of the drawn components. Each entry includes the number of times it was drawn and the slowest/fastest and average drawing time. The toolbar across the top includes Pause/Continue buttons so you can freeze the counters while you inspect the current snapshot, a "Clear Data" action to reset the tables, and a "GC" button that invokes the simulator’s garbage collector so you can see how memory usage changes.
This is useful if a Form is slow. You might be able to pinpoint it to a specific component using this tool.
The Log on the bottom includes debug related information. For example, it warns about the usage of mutable images which might be slow on some platforms. This also displays warnings when an unlocked image is drawn etc. A live "Image Memory Overhead" meter summarizes how much native image memory the current form consumes so you can correlate spikes with your drawing code.
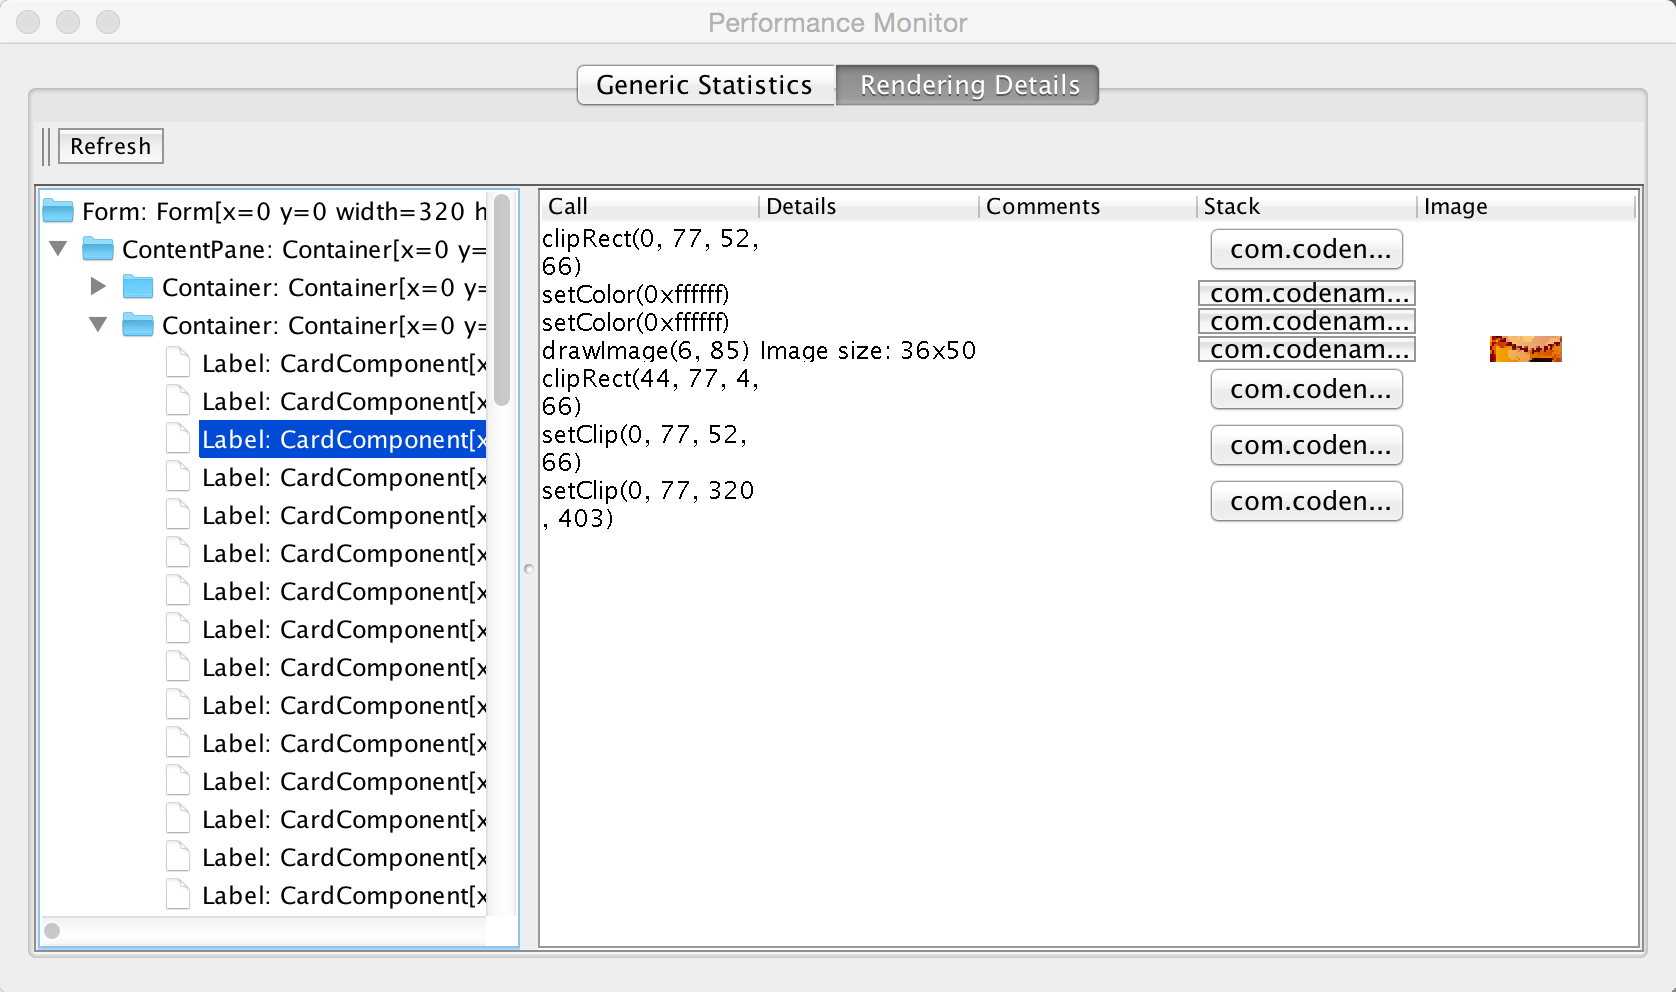
The rendering tree view allows you to inspect the hierarchy painting. You can press the refresh button which will trigger the painting of the current Form. Every graphics operation is logged and so is the stack to it.
You can then inspect the hierarchy and see what was drawn by the various components. You can click the "stack" buttons to see the specific stack trace that lead to that specific drawing operation.
This is a powerful debugging tool as you can see "overdraw" within this tool. E.g if you see fillRect or similar APIs invoked in the parent and then again and again in the children this could show a problem.
Network speed
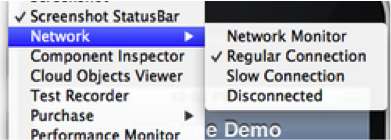
This feature is actually more useful for general debugging but it’s sometimes useful to simulate a slow/disconnected network to see how this affects performance.
For this purpose the Codename One simulator allows you to slow down networking or even fake a disconnected network to see how your application handles such cases.
Debugging Codename One sources
When you debug your app with your source code you can place breakpoints deep within Codename One and gain unique insight. You can also use the profilers and profile into Codename One to gain similar performance specific insight.
Running against the framework sources rather than the released jars is covered in working with Codename One sources.
Device testing Framework/Unit testing
Codename One includes a built in testing framework and test recorder tool as part of the simulator. This allows developers to build both functional and unit test execution on top of Codename One. It even enables sending tests for execution on the device (pro-feature).
To get started with the testing framework, launch the application and open the test recorder in the simulator menu.
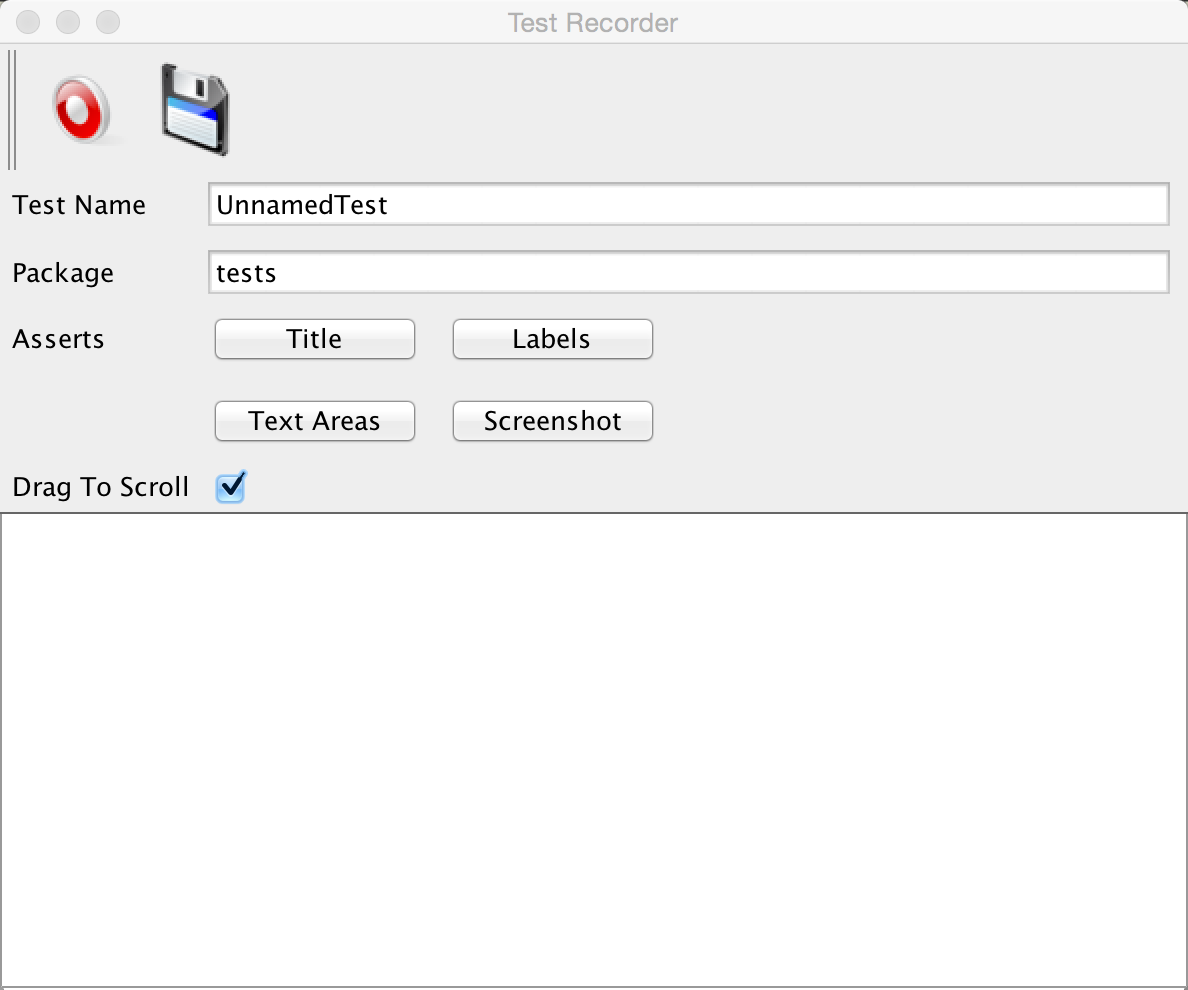
Once you press record a test will be generated for you as you use the application.
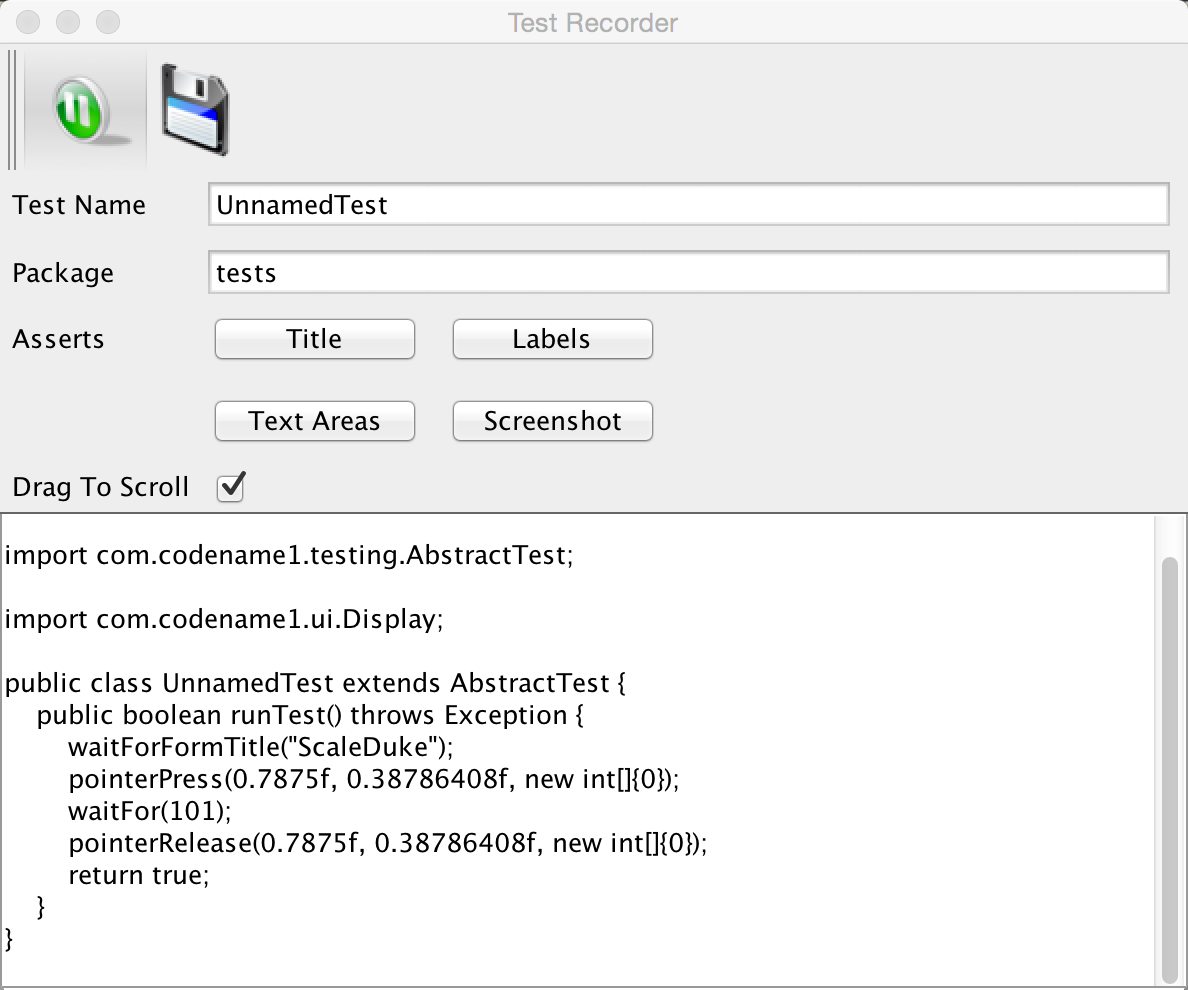
You can build tests using the Codename One testing package to manipulate the Codename One UI programmatically and perform various assertions.
Unlike frameworks such as JUnit which assign a method per test, the Codename One test framework uses a class per test. This allows the framework to avoid reflection and thus allows it to work on the device.
EDT error handler and sendlog
Handling errors or exceptions in a deployed product is pretty difficult, most users would throw away your app and some would give it a negative rating without providing you with the opportunity to actually fix the bug that might have happened.
Google improved on this a bit by allowing users to submit stack traces for failures on Android devices but this requires the users approval for sending personal data which you might not need if you want to receive the stack trace and maybe some basic application state (without violating user privacy).
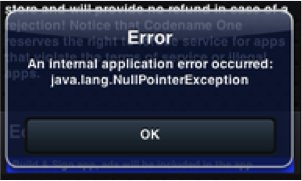
For quite some time Codename One had a powerful feature that allows you to both catch and report such errors, the error reporting feature uses the Codename One cloud which is exclusive for pro/enterprise users. In Codename One you catch all exceptions on the EDT (which is where most exceptions occur) and display an error to the user as you can see in the picture. This isn’t helpful to you as developers who want to see the stack; furthermore you might prefer the user doesn’t see an error message at all!
Codename One allows you to grab all exceptions that occur on the EDT and handle them using the method addEdtErrorHandler in the Display class. Adding this to the Log’s ability to report errors directly to you and you can get a powerful tool that will send you an email with information when a crash occurs!
This can be accomplished with a single line of code:
Log.bindCrashProtection(true);
You place this in the init(Object) method so all future on-device errors are emailed to you. Internally this method uses the Display.getInstance().addEdtErrorHandler() API to bind error listeners to the EDT. When an exception is thrown there it’s swallowed (using ActionEvent.consume()). The Log data is then sent using Log.sendLog().
If your crash handler runs while networking is unavailable or you want to avoid
blocking the EDT, use Log.sendLogAsync() instead. It performs the upload in a
background thread and is what Codename One’s lifecycle helper falls back to when
regular error reporting fails.
You can also plug in your own crash reporting pipeline by calling
Display.getInstance().setCrashReporter(CrashReport). The
CrashReport
callback will receive the exception, device information, and log payload so you
can forward it to services like Firebase Crashlytics or your in-house tools.
To truly gain from this feature you need to use the Log class for all logging and exception handling instead of APIs such as System.out.
To log standard printouts you can use the Log.p(String) method and to log exceptions with their stack trace you can use Log.e(Throwable).
Kitchen sink case study
Performance is one of those vague subjects that’s often taught by example.
While debugging the contacts demo (part of the new kitchen sink demo), its performance appeared sub-par. The initial assumption was that this was due to the implementation of getAllContacts and that there was nothing to do. Later, while debugging an unrelated issue, an anomaly was noticed during the loading of the contacts.
This led to the discovery that you’re loading the same resource file over and over again for every single contact in the list!
In the new Contacts demo you have a share button for each contact, the code for constructing a ShareButton looks like this:
public ShareButton() {
    setUIID("ShareButton");
    FontImage.setMaterialIcon(this, FontImage.MATERIAL_SHARE);
    addActionListener(this);
    shareServices.addElement(new SMSShare());
    shareServices.addElement(new EmailShare());
    shareServices.addElement(new FacebookShare());
}
This seems reasonable until you realize that the constructors for SMSShare, EmailShare & FacebookShare load the icons for each of those…
These icons are in a shared resource file that you load and don’t cache. The initial workaround was to cache this resource but a better solution was to convert this code:
public SMSShare() {
    super("SMS", Resources.getSystemResource().getImage("sms.png"));
}
Into this code:
@Override
public Image getIcon() {
    Image i = super.getIcon();
    if(i == null) {
        i = Resources.getSystemResource().getImage("sms.png");
        setIcon(i);
    }
    return i;
}
This way the resource uses lazy loading as needed.
This small change boosted the loading performance and probably the general performance due to less memory fragmentation.
The lesson that you should learn every day is to never assume about performance…
Scroll performance - threads aren’t magic
Another performance pitfall in this same demo came during scrolling. Scrolling was janky (uneven/unsmooth) right after loading finished would recover after a couple of minutes.
This relates to the images of the contacts.
To hasten the loading of contacts you load them all without images. You then launch a thread that iterates the contacts and loads an individual image for a contact. Then sets that image to the contact and replaces the placeholder image.
This performed well in the simulator but didn’t do too well even on powerful mobile phones. You assumed this wouldn’t be a problem because you used Util.sleep() to yield CPU time but that wasn’t enough.
Often when you see performance penalty the response is: "move it to a separate thread." The problem is that this separate thread needs to compete for the same system resources and merge its changes back into the EDT. When you perform something intensive you need to make sure that the CPU isn’t needed right now…
In this and past cases you solved this using a class member indicating the last time a user interacted with the UI.
Here you defined:
private volatile long lastScroll;
The field is volatile because the listeners further down write it on the event dispatch thread while the loading thread reads it. Without that, the loader can keep seeing a stale timestamp and carry on decoding images while the user is still scrolling, which is the uneven scrolling this section sets out to remove.
Then you did this within the background loading thread:
// don't do anything while we are scrolling or animating
long idle = System.currentTimeMillis() - lastScroll;
while(idle < 1500 || contactsDemo.getAnimationManager().isAnimating() || scrollY != contactsDemo.getScrollY()) {
    scrollY = contactsDemo.getScrollY();
    Util.sleep(Math.min(1500, Math.max(100, 2000 - ((int)idle))));
    idle = System.currentTimeMillis() - lastScroll;
}
This effectively sleeps when the user interacts with the UI and loads the images if the user hasn’t touched the UI in a while.
Notice that you also check if the scroll changes, this allows you to notice cases like the animation of scroll winding down.
All you need to do now is update the lastScroll variable whenever user interaction is in place. This works for user touches:
parentForm.addPointerDraggedListener(e -> lastScroll = System.currentTimeMillis());
This works for general scrolling:
contactsDemo.addScrollListener(new ScrollListener() {
    int initial = -1;
    @Override
    public void scrollChanged(int scrollX, int scrollY, int oldscrollX, int oldscrollY) {
        // scrolling is sensitive on devices...
        if(initial < 0) {
            initial = scrollY;
        }
        lastScroll = System.currentTimeMillis();
        // ...
    }
});