The companion to the iOS chapter, for the Android side. The motivation
is the same — bugs that only reproduce on a real device or on the
Android emulator — but the implementation is much simpler. The
Dalvik/ART runtime already exposes a JDWP socket per debuggable
process, so there is no desktop proxy and no custom protocol. The
Codename One Maven plugin just orchestrates adb: install the APK,
mark it as the debug-app, launch the activity, forward the JDWP
socket onto localhost, and tail logcat.
Everything below assumes you have the Android platform-tools on your
machine (Android Studio installs them, or
the
standalone package) and adb is reachable through ANDROID_HOME,
ANDROID_SDK_ROOT, or $PATH.
When to use it
A bug only reproduces on a physical Android device or in the Android emulator and not in the Codename One simulator.
You want to single-step through your code while it runs on the device, with full access to locals, fields, and the
Display.getInstance()…accessor chains.You want to attach without a USB cable — the wireless flow below covers both the legacy
adb tcpippath and the Android 11+adb pairpath.
If the bug reproduces in the simulator, stay in the simulator — its debugger is faster and has zero device-side moving parts.
Quick start (IntelliJ IDEA)
Projects generated from the cn1app-archetype ship with two run
configurations under the On-Device Debug folder: CN1 Android
On-Device Debug and CN1 Attach Android. The flow is:
1. Enable the build hint
In common/codenameone_settings.properties, uncomment the line the
archetype generated:
codename1.arg.android.onDeviceDebug=true
The build hint name is android.onDeviceDebug. Entries in
codenameone_settings.properties use the codename1.arg. prefix, as
shown above.
This flips the generated AndroidManifest.xml to
debuggable="true" and disables R8/proguard so symbols and locals
survive the build. Release builds (anything without this hint) are
unaffected.
2. Build the APK
Either the cloud build (cn1:buildAndroidOnDeviceDebug — wraps
cn1:buildAndroid and force-sets the hint above) or your usual
cn1:buildAndroid once the hint is set. Both produce a signed,
debuggable APK in the project’s target/ directory.
For a fully local build, use cn1:buildAndroidGradleProject to
generate the Gradle project under target/…-android-source/ and
run ./gradlew assembleDebug from there; the Mojo will autodetect
the resulting APK under build/outputs/apk/.
3. Connect the device
Plug a device in over USB with USB debugging enabled, or connect wirelessly (see Wireless debugging below).
4. Run the debug session from IntelliJ
Select CN1 Android On-Device Debug from the Run-config dropdown and click ▶ Run (the green play icon — not the bug icon). The Run tool window prints:
Using adb: /Users/you/Library/Android/sdk/platform-tools/adb
Target device: emulator-5554
Installing my-app-1.0.apk on emulator-5554
Marking com.example.myapp as the debug app (waits for debugger).
Launching com.example.myapp.MyAppStub
App PID on device: 12345

==================================================================
 JDWP forwarded:  localhost:5005  ->  device pid 12345
 Attach IntelliJ: Run -> 'CN1 Attach Android' (Remote JVM Debug)
==================================================================
After that banner, logcat output (filtered to the app’s PID) streams
through the Run window prefixed with [device].
5. Attach the debugger
Switch the Run-config dropdown to CN1 Attach Android and click 🐞
Debug. IntelliJ connects to localhost:5005 and opens a Debug tool
window. The app is paused inside Debug.waitForDebugger() at this
point — set your breakpoints, then resume from the IDE to let it
proceed past boot.
Set breakpoints, step, inspect, evaluate expressions — all the normal remote-attach features work. Unlike the iOS path, there is no method-invocation or static-field limitation here; the JVM is the real Android runtime.
Wireless debugging
Android 11 and newer (recommended)
On the device: Settings → Developer options → Wireless debugging → Pair device with pairing code. Note the IP & port (for example
192.168.1.42:37051) and the six-digit pairing code.Pair from your laptop (this only has to be done once per network):
adb pair 192.168.1.42:37051
# When prompted, enter the 6-digit code shown on the device.
Connect:
adb connect 192.168.1.42:5555The connect port is not the pairing port — it’s the one shown on the Wireless debugging screen above the Pair device button.
Run the debug session as normal. Pass the IP and port through the Mojo if you prefer to do the
adb connectin one step:mvn cn1:android-on-device-debugging \ -Dcn1.android.onDeviceDebug.wireless=192.168.1.42:5555
Android 10 and older
Plug the device in over USB.
Switch adb to TCP/IP mode and grab the device’s IP from Settings → About phone → Status:
adb tcpip 5555
adb connect 192.168.1.42:5555
Unplug the cable, then run the debug session as normal.
In either flow, the JDWP forward, app launch, and logcat stream all happen over the same Wi-Fi link.
Quick start (Maven from the command line)
Without the IntelliJ run configs, the same flow is two terminals:
# Terminal 1 — build the APK once
mvn cn1:buildAndroidOnDeviceDebug

# Terminal 2 — install, launch, forward JDWP, tail logcat
mvn cn1:android-on-device-debugging
Attach jdb (or another JDWP client) to the forwarded port:
jdb -attach localhost:5005 \
    -sourcepath src/main/java:$HOME/.m2/repository/com/codenameone/codenameone-core/8.0-SNAPSHOT/codenameone-core-8.0-SNAPSHOT-sources.jar
For VS Code (Debugger for Java extension), add a launch
configuration of type java with "request": "attach",
"hostName": "localhost", "port": 5005.
Useful command-line flags
The Mojo’s defaults match what the archetype’s run config does. The flags below exist for unusual setups:
| Property | Meaning |
|---|---|
| Use a specific adb executable (default: search |
| Force a target device when more than one is online
( |
| Run |
| Local TCP port for |
| Skip APK autodetection and install this APK instead. |
| Skip the install step — the app is already on the device. |
| Don’t run |
What you can step through
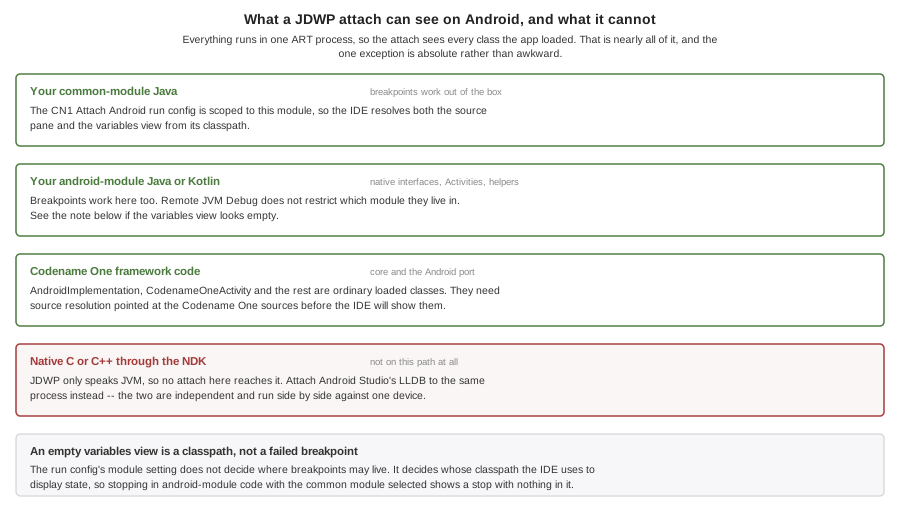
Everything runs in one Dalvik/ART process, so the JDWP attach sees every class loaded by the app. In practical terms:
Your common-module Java (
com.<yourcompany>.<app>., anything under the-commonmodule’ssrc/main/java). Breakpoints work out of the box — this is the module the *CN1 Attach Android run config is scoped to, so IntelliJ resolves the source pane and the variables view from your common-module classpath.Your android-module Java or Kotlin (
src/main/javaof the-androidmodule — native interface implementations, custom Activities, Android-only helpers). Open the file and set a breakpoint; the IDE’s Remote JVM Debug config doesn’t restrict which module breakpoints live in, the<module>setting only decides which module’s classpath is used to display state. If the variables view ever looks empty when you stop inside-androidcode, switch the run config’s Use classpath of module to the-androidmodule and reattach.Codename One framework code in
codenameone-coreand the Android port (com.codename1.impl.android.*such asAndroidImplementationandCodenameOneActivity). Both need source resolution — see the next section.*Native C/C via the NDK* is *not* debuggable through this path. JDWP only speaks JVM. If you've added native sources through the Android NDK, attach Android Studio's LLDB to the same process for C/C debugging — the two attaches are independent and can run side-by-side against one device.
Pointing the IDE at the Codename One sources
The Android runtime serves real .class files, so the IDE only needs
the matching .java files to render the source pane. The same two
options cover both codenameone-core and the Android port
(codenameone-android):
Maven sources jars (recommended). IntelliJ resolves
codenameone-core-<version>-sources.jarandcodenameone-android-<version>-sources.jarautomatically once you run Maven → Reimport with "Sources" enabled in the Maven settings.Local clone of the Codename One GitHub repository. In IntelliJ: Run → Edit Configurations… → CN1 Attach Android → Configuration → Source roots → +. Add two entries: the clone’s
CodenameOne/srcdirectory for the framework core, andPorts/Android/srcforAndroidImplementationand the rest of the Android port.
Without a source path, breakpoints in framework classes still trigger and locals / fields still read — you’ll just see "Sources not found" in the editor when stepping into framework code.
Debugging the generated Gradle project from Android Studio
Everything above drives a Codename One-built APK through adb. The
alternative is to open the generated Android project itself in Android
Studio and use it like any native Android app — useful when you’re
debugging native interface code, working on the Android port, or want
Android Studio’s profiler and layout inspector:
Local build:
mvn cn1:buildAndroidGradleProjectwrites a complete Gradle project undertarget/…-android-source/. Open that directory in Android Studio (current versions open it directly — no Gradle version fiddling required), connect a device, and press Debug.Cloud build: check the Include Source flag in Codename One Settings before sending the build, then download the sources result from the build server and open it the same way.
When iterating, regenerate the project rather than hand-merging files — the generated project is a build artifact, not a source of truth.
For native C/C++ added through the NDK, attach Android Studio’s LLDB to the process; as noted in What you can step through, the LLDB and JDWP attaches are independent and can run side by side against one device.
Troubleshooting
"No Android device is online"
adb devices returns nothing useful. Common causes:
The device’s USB debugging toggle is off, or the per-laptop RSA fingerprint prompt is still pending on-device.
The cable is power-only (some short USB-C cables are charge-only).
For wireless: pairing expired (Android 11+) or the laptop is on a different Wi-Fi network.
"Multiple devices online"
Pass -Dcn1.android.onDeviceDebug.deviceSerial=<serial> (run
adb devices to see serials). The emulator’s serial looks like
emulator-5554; a USB-attached phone is its hardware ID; a wireless
device is <ip>:<port>.
App installs but won’t pause for the debugger
waitForAttach only takes effect when the APK is built with
android.onDeviceDebug=true (or android.xapplication_attr
containing android:debuggable="true"). Verify by running
adb shell dumpsys package <your.package> | grep flags — DEBUGGABLE
must be in the list. If it isn’t, rebuild with
mvn cn1:buildAndroidOnDeviceDebug.
Breakpoint never fires
Check the CN1 Attach Android run config:
Host is
localhost, Port matches thejdwpPortprinted by the debug session.The Use module classpath dropdown is the
-commonmodule, so IntelliJ can resolve your.javafiles.
If a class loaded on the device doesn’t match the class IntelliJ
thinks is current, breakpoints stop firing with no error message.
Rebuild and reinstall (cn1:buildAndroidOnDeviceDebug + re-run
CN1 Android On-Device Debug).
logcat shows the app exiting with Debug.waitForDebugger-like noise
The system killed the process for taking too long to attach. Set
-Dcn1.android.onDeviceDebug.waitForAttach=false and trigger the
code path you want to debug manually after attach — Android’s debug-app
wait isn’t bound to the breakpoint, only to process start.
Wireless connection drops mid-session
Wi-Fi connections to debug-mode devices are sensitive to power-saving.
On the device, keep the screen on (or set Settings → Developer
options → Stay awake while charging). For long sessions, plug into
USB and use adb -s <wireless-serial> to keep the wireless TCP socket
alive without depending on the radio.