Some ideas are easiest to explain as boxes and the lines between them: the
services of a system and who calls whom, an organization chart, a dependency
map, or a pipeline the user builds by wiring blocks together. NodeGraph
covers both kinds. It shows a diagram the application lays out, and it’s an
editor in which the user drags nodes and connects their ports.
The component is in com.codename1.ui.graph. It draws from a model in
com.codename1.graph that has no user interface in it, so a graph can be
built, laid out, tested and stored without a form on the screen. The arrangements are
in com.codename1.graph.arrange.
NodeGraph paints its nodes and edges directly instead of building a
component for each one. A graph with thousands of nodes pans and zooms the way
one with ten does, because only what’s on the screen is drawn. When the user
zooms far out, nodes are drawn as plain cards without text.
A first graph
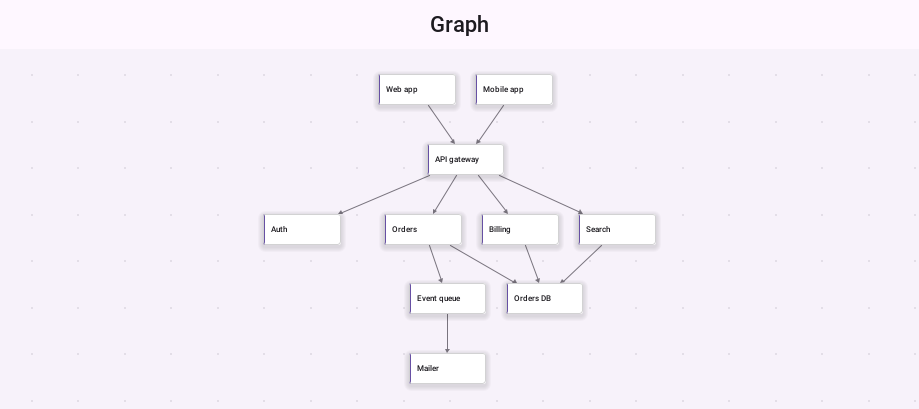
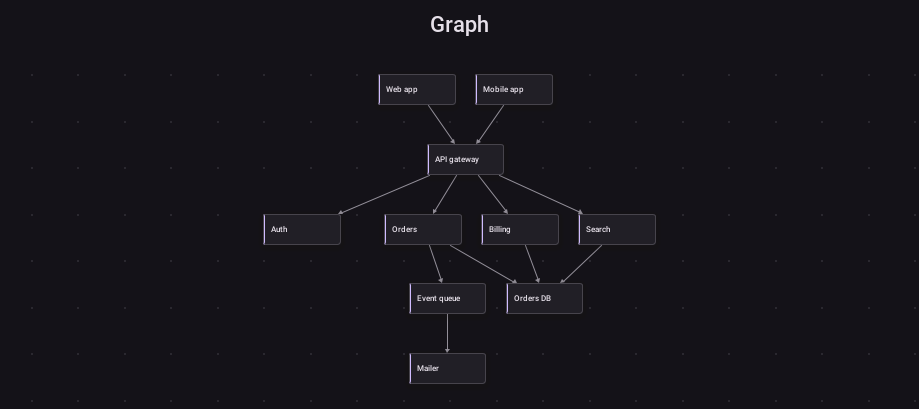
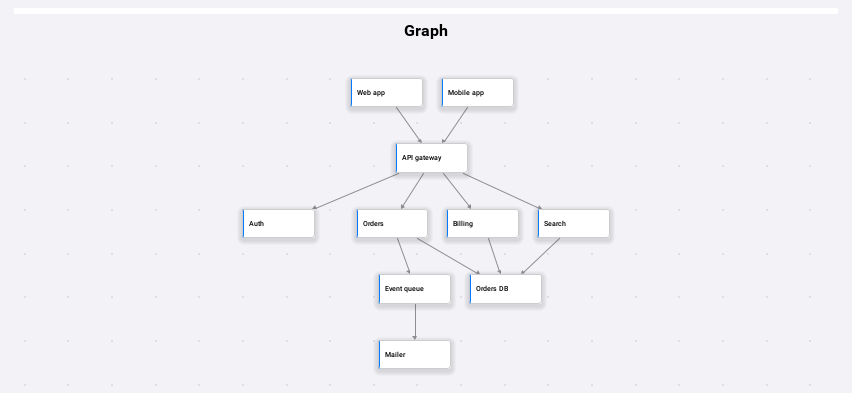
A GraphNode has an id and a label, and addEdge connects two nodes by
their ids. An arrangement gives each node a position, and fitToView zooms so the
whole graph is in view.
DefaultGraphModel model = new DefaultGraphModel();
model.addNode(new GraphNode("web", "Web app"));
model.addNode(new GraphNode("api", "API gateway"));
model.addNode(new GraphNode("orders", "Orders"));
model.addNode(new GraphNode("billing", "Billing"));
model.addNode(new GraphNode("db", "Database"));
model.addEdge("web", "api");
model.addEdge("api", "orders");
model.addEdge("api", "billing");
model.addEdge("orders", "db");
model.addEdge("billing", "db");

NodeGraph graph = new NodeGraph(model);
graph.arrange(new LayeredArrangement(), false);

Form form = new Form("Services", new BorderLayout());
form.add(BorderLayout.CENTER, graph);
form.show();
graph.fitToView();
Give the graph the center of a BorderLayout. It pans and zooms inside the
room it’s given, so it doesn’t belong in a container that scrolls too. The
user pans by dragging the background, zooms with a pinch or the mouse wheel,
and taps a node to select it.
Groups, labels and styles
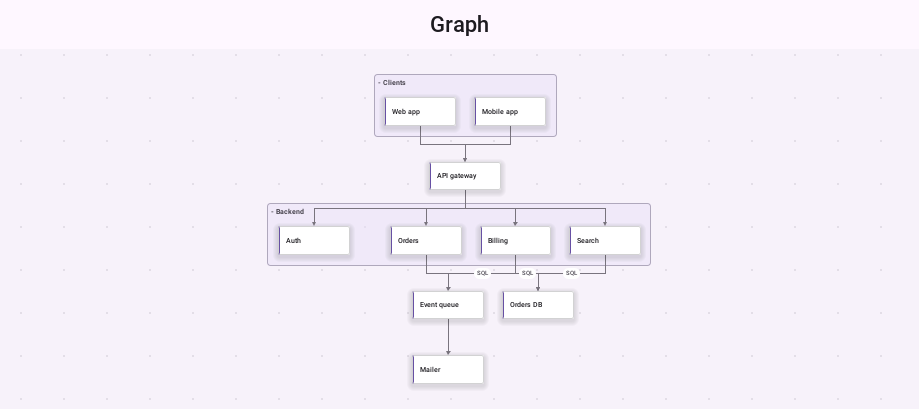
A GraphGroup draws a frame around the nodes that name it, with its label in
the corner. Tapping that label collapses the group to a single card, and
tapping it again opens it. An edge can carry a label, drawn in a pill at its
middle, and a style key that the renderers use to pick a color.
DefaultGraphModel model = new DefaultGraphModel();
model.addNode(new GraphNode("orders", "Orders"));
model.addNode(new GraphNode("billing", "Billing"));
model.addNode(new GraphNode("db", "Database"));

model.addGroup(new GraphGroup("backend", "Backend"));
model.getNode("orders").setGroupId("backend");
model.getNode("billing").setGroupId("backend");

GraphEdge write = model.addEdge("orders", "db");
write.setLabel("writes");
model.getNode("db").setStyleKey("storage");
setEdgeStyle chooses how edges are drawn: EDGE_STRAIGHT,
EDGE_ORTHOGONAL, EDGE_CURVED, or EDGE_AUTO, which follows the route an
arrangement computed when there is one.
Arrangements
An arrangement reads the model and returns a position for every node.
arrange(arrangement, true) animates the nodes to their new places, and
false moves them at once. A graph with no arrangement keeps the positions its
nodes were given, which is the manual mode a node editor uses.
DefaultGraphModel model = new DefaultGraphModel();
model.addNode(new GraphNode("ceo", "CEO"));
model.addNode(new GraphNode("cto", "CTO"));
model.addNode(new GraphNode("cfo", "CFO"));
model.addEdge("ceo", "cto");
model.addEdge("ceo", "cfo");
NodeGraph graph = new NodeGraph(model);

LayeredArrangement layered = new LayeredArrangement();
layered.setDirection(LayeredArrangement.LEFT_TO_RIGHT);
graph.arrange(layered, true);

TreeArrangement tree = new TreeArrangement();
tree.setRootId("ceo");
graph.arrange(tree, true);

graph.arrange(new RadialArrangement(), true);

ForceArrangement force = new ForceArrangement();
force.setIdealLength(140);
graph.arrange(force, true);| Arrangement | Good for |
|---|---|
| Flows and dependencies. Nodes go in layers along the direction of their edges, ordered to keep edges from crossing, and long edges are routed around the layers between their ends. |
| Hierarchies such as an organization chart. Each parent sits centered over its children, and subtrees never overlap. |
| The same hierarchy as rings around the root. |
| Networks with no natural direction. Connected nodes pull together and all nodes push apart, until the graph settles. |
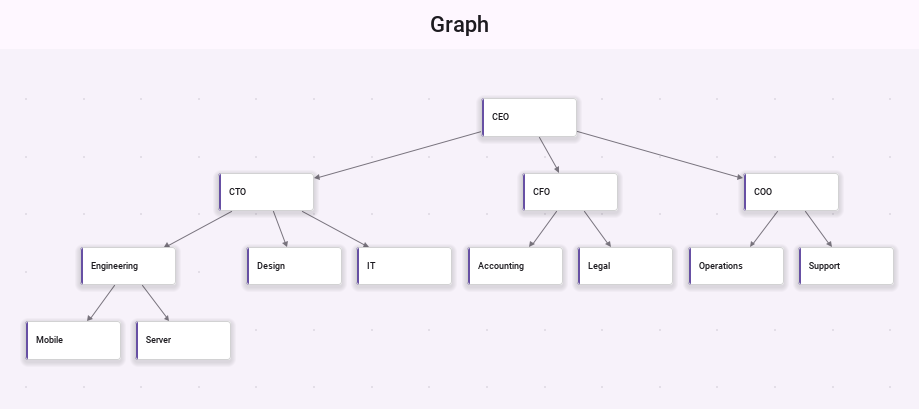
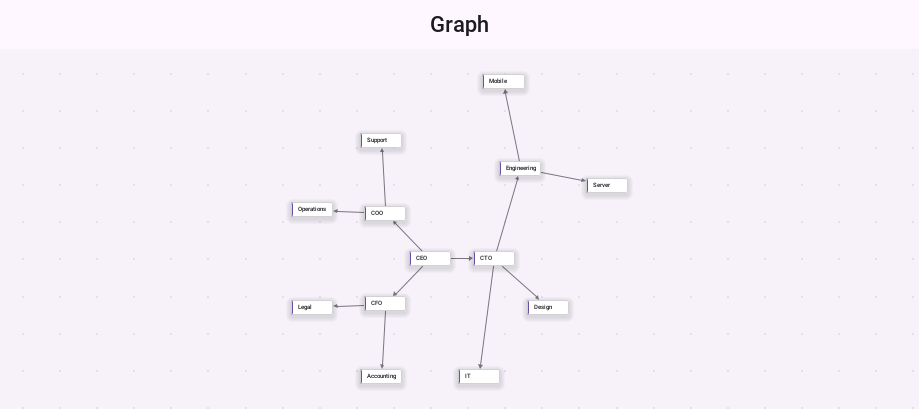
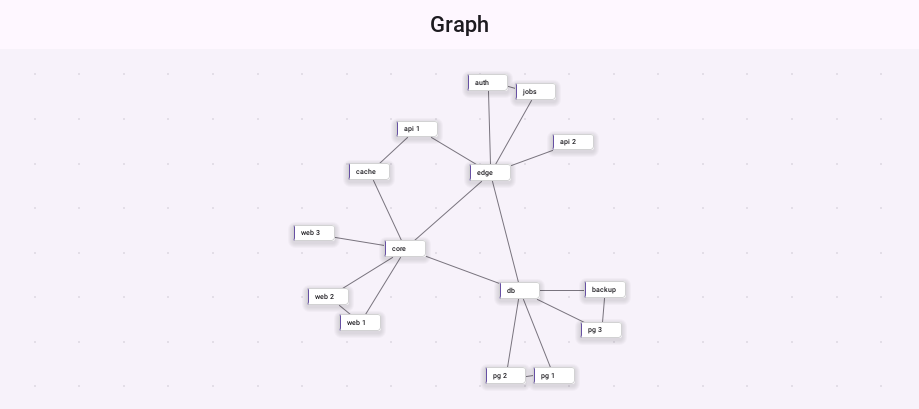
ForceArrangement can also run live while the user works. Dragged nodes stay
where the user holds them, and the rest of the graph moves around them.
NodeGraph graph = new NodeGraph();
graph.setLiveArrangement(new ForceArrangement());
A node marked with setPinned(true) stays where it’s while ForceArrangement
arranges the others.
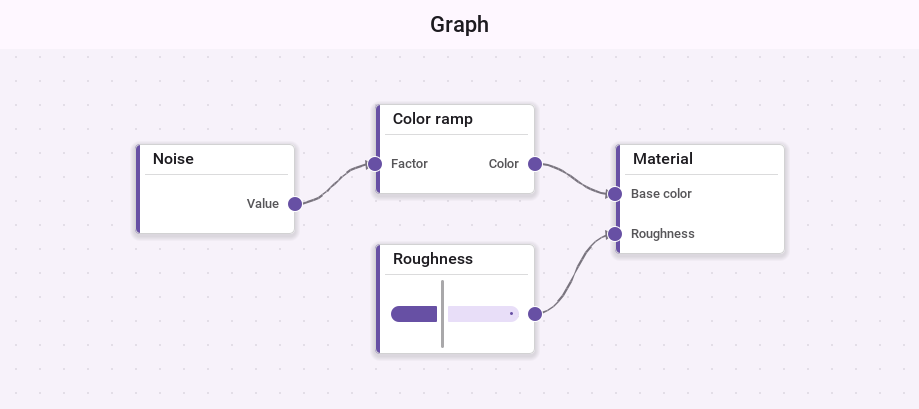
A node editor
Give a node ports and the graph becomes an editor. Inputs are drawn on one
side of the card and outputs on the other. With editing on, the user drags
from an output to an input to connect them, drags nodes around, long presses
or Shift-drags the background to select several with a box, and deletes what’s selected with
deleteSelection. setLabelEditing(true) also lets the user double tap a
node to rename it.
DefaultGraphModel model = new DefaultGraphModel();
model.addNode(new GraphNode("noise", "Noise", 0, 0, 160, 90)
        .addOutput("out", "Value", "float"));
model.addNode(new GraphNode("color", "Color ramp", 240, 0, 160, 90)
        .addInput("in", "Factor", "float")
        .addOutput("out", "Color", "color"));
model.addNode(new GraphNode("material", "Material", 480, 0, 160, 110)
        .addInput("base", "Base color", "color")
        .addInput("rough", "Roughness", "float"));

NodeGraph graph = new NodeGraph(model);
graph.setEditingEnabled(true);
graph.setGridVisible(true);
graph.setSnap(20);
graph.setEdgeStyle(NodeGraph.EDGE_CURVED);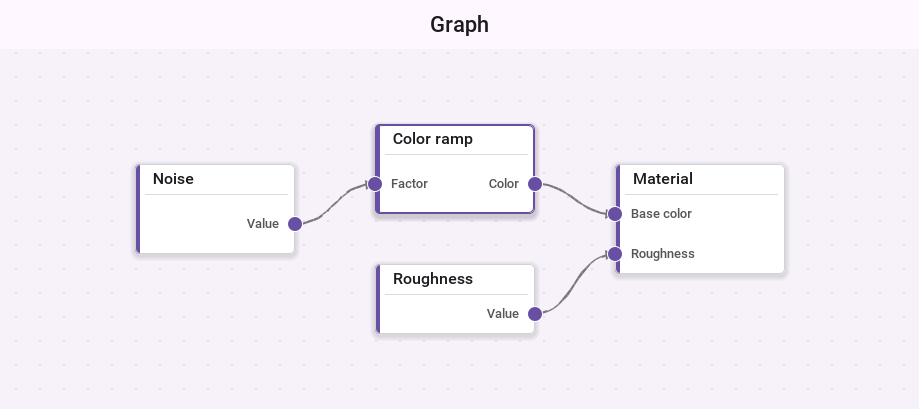
A port has a type. The model’s ConnectionValidator refuses an edge between
ports whose types differ, from an input to an input, from a node to itself, a
second copy of an edge that exists, and an edge past a port’s
setMaxConnections limit. setAllowCycles(false) also refuses an edge that
would close a loop. While the user drags a connection, the port under the
finger shows whether it would accept it, and a drop on a port that refuses it
connects to the nearest one on that node that accepts it.
Nodes without ports can be connected too. A selected node shows a handle on its trailing edge, and dragging from it, or from a long press on the node, draws a new edge to wherever it’s dropped.
Listening and refusing
Every change the user makes is offered to the graph’s listeners before it
reaches the model. A listener that returns false refuses it, and nothing
changes. Extend GraphAdapter to implement only what you need.
NodeGraph editor = new NodeGraph();
editor.addGraphListener(new GraphAdapter() {
    @Override
    public boolean edgeCreating(NodeGraph g, GraphNode source, GraphPort sourcePort,
            GraphNode target, GraphPort targetPort) {
        return !"material".equals(source.getId());
    }

    @Override
    public void edgeCreated(NodeGraph g, GraphEdge edge) {
        Log.p("Connected " + edge.getSourceId() + " to " + edge.getTargetId());
    }
});
A model of your own implements GraphModel, or extends AbstractGraphModel
for the listener plumbing. Its moveNode, connect, removeNode and the
other edit methods return false to refuse a change, which makes a read-only
model the default.
Components inside nodes
Nodes are painted, but a node can carry a real component as well: a slider, a
text field or a button. The factory is asked for one per node, and a node it
returns null for stays painted. The component is placed over the node’s card
while the node is on the screen and the zoom is above setComponentZoom. Below
that, the card is painted alone.
NodeGraph graph = new NodeGraph();
graph.setNodeComponentFactory(new NodeComponentFactory() {
    @Override
    public Component createComponent(NodeGraph g, GraphNode node) {
        if (!"material".equals(node.getId())) {
            return null;
        }
        return new Slider();
    }
});
Finding your way
setMinimapVisible(true) shows a small map of the whole graph in a corner,
with the part on the screen outlined. Tapping the map moves the view there.
centerOn(node) moves the view to a node, setZoomRange limits how far the
user can zoom, and toImage paints the whole graph into an image for sharing
or printing.
Styling
The graph is styled through these UIIDs, which the native themes define:
| UIID | Used for |
|---|---|
| The background |
| The grid lines, when the grid is on |
| A node’s card, its border and its text |
| A selected node |
| A group’s frame and label |
| The ports |
| The edges and their arrows |
| The pill behind an edge label |
| The minimap |
For more than colors, implement GraphNodeRenderer or GraphEdgeRenderer,
or extend the default ones, and pass them to setNodeRenderer and
setEdgeRenderer.