
The current Linux ARM64 performance baseline has ParparVM translating its own compiler in 37.5% less elapsed time and 45.8% less peak memory than JDK 25. Across all 16 recorded machine configurations, self-translation takes 22.5% to 56.6% less elapsed time. The gains vary by OS and processor; the chart and table include every configuration. Your Java source does not need to change to benefit from a smaller runtime and a compiler that removes more work.

These are the repository’s checked-in performance baselines, read on October 1. They are recorded reference results used to detect regressions, not new measurements made for this article. Each comparison runs the same translator classes on the two runtimes and verifies the generated files byte for byte.
| Self-translation baseline | Elapsed time, ParparVM / JDK 25 | Peak memory, ParparVM / JDK 25 | Recorded calibration runs |
|---|---|---|---|
| Linux ARM64, Neoverse N2 | 0.625 | 0.542 | 7 |
| Linux x64, EPYC 7763 | 0.484 | 0.519 | 3 |
| Linux x64, EPYC 9V45 | 0.495 | 0.539 | 1 |
| Linux x64, EPYC 9V74 | 0.516 | 0.522 | 2 |
| Linux x64, Xeon 6973P-C | 0.537 | 0.520 | 1 |
| Linux x64, Xeon Platinum 8370C | 0.434 | 0.509 | 3 |
| Linux x64, Xeon Platinum 8573C | 0.505 | 0.517 | 1 |
| macOS ARM64 | 0.539 | 0.739 | 1 |
| Windows ARM64, model D49 | 0.751 | 0.539 | 7 |
| Windows ARM64, model D84 | 0.775 | 0.570 | 1 |
| Windows x64, AMD family 25/model 1 | 0.606 | 0.542 | 7 |
| Windows x64, AMD family 25/model 17 | 0.636 | 0.551 | 2 |
| Windows x64, AMD family 26/model 2 | 0.611 | 0.546 | 1 |
| Windows x64, Intel family 6/model 106 | 0.627 | 0.536 | 1 |
| Windows x64, Intel family 6/model 173 | 0.677 | 0.549 | 1 |
| Windows x64, Intel family 6/model 207 | 0.602 | 0.526 | 1 |
Lower is better in both columns. JDK 25 is 1.0. Each baseline is the median of the recorded runs’ median ratios, with each platform using its available CPUs and runtime defaults. Translation time includes the whole process; Linux and macOS memory is peak RSS; Windows memory is peak working set. Some configurations have only one calibration run, as shown. They are separate machines, not a core-count scaling test.
A couple of weeks ago I wrote about making ParparVM compile itself. HotSpot beat us on elapsed time. That was disappointing, though hardly surprising. Since then we have worked on object layout, collections, generated C and garbage collection. The results above are a much better place to be.
The smaller objects matter beyond the compiler benchmark. In Friday’s server comparison, CN1’s native backend peaks at 57.8 MiB RSS, against 117.0 MiB for Spring/GraalVM, and rests at 29.8 MiB after load against 79.6 MiB. That compares complete HTTP stacks. Here we will look at the runtime changes that help make a smaller Java process possible.
What gets faster, and what still needs work?
Self-translation is a substantial Java workload: allocating objects, walking collections, resolving methods and writing generated C. It is also our own compiler, so we should check other workloads before treating it as a verdict on Java performance.
The complete Linux ARM64 baseline contains 13 workloads. ParparVM uses less peak memory in all 13 and less elapsed time in eight. Sequential array access takes 0.362 times the JDK’s measured time; hash-map churn uses 0.121 times its peak process memory. Allocation remains an important weakness: that workload takes 3.043 times the JDK’s time, even while using 0.239 times its peak memory.
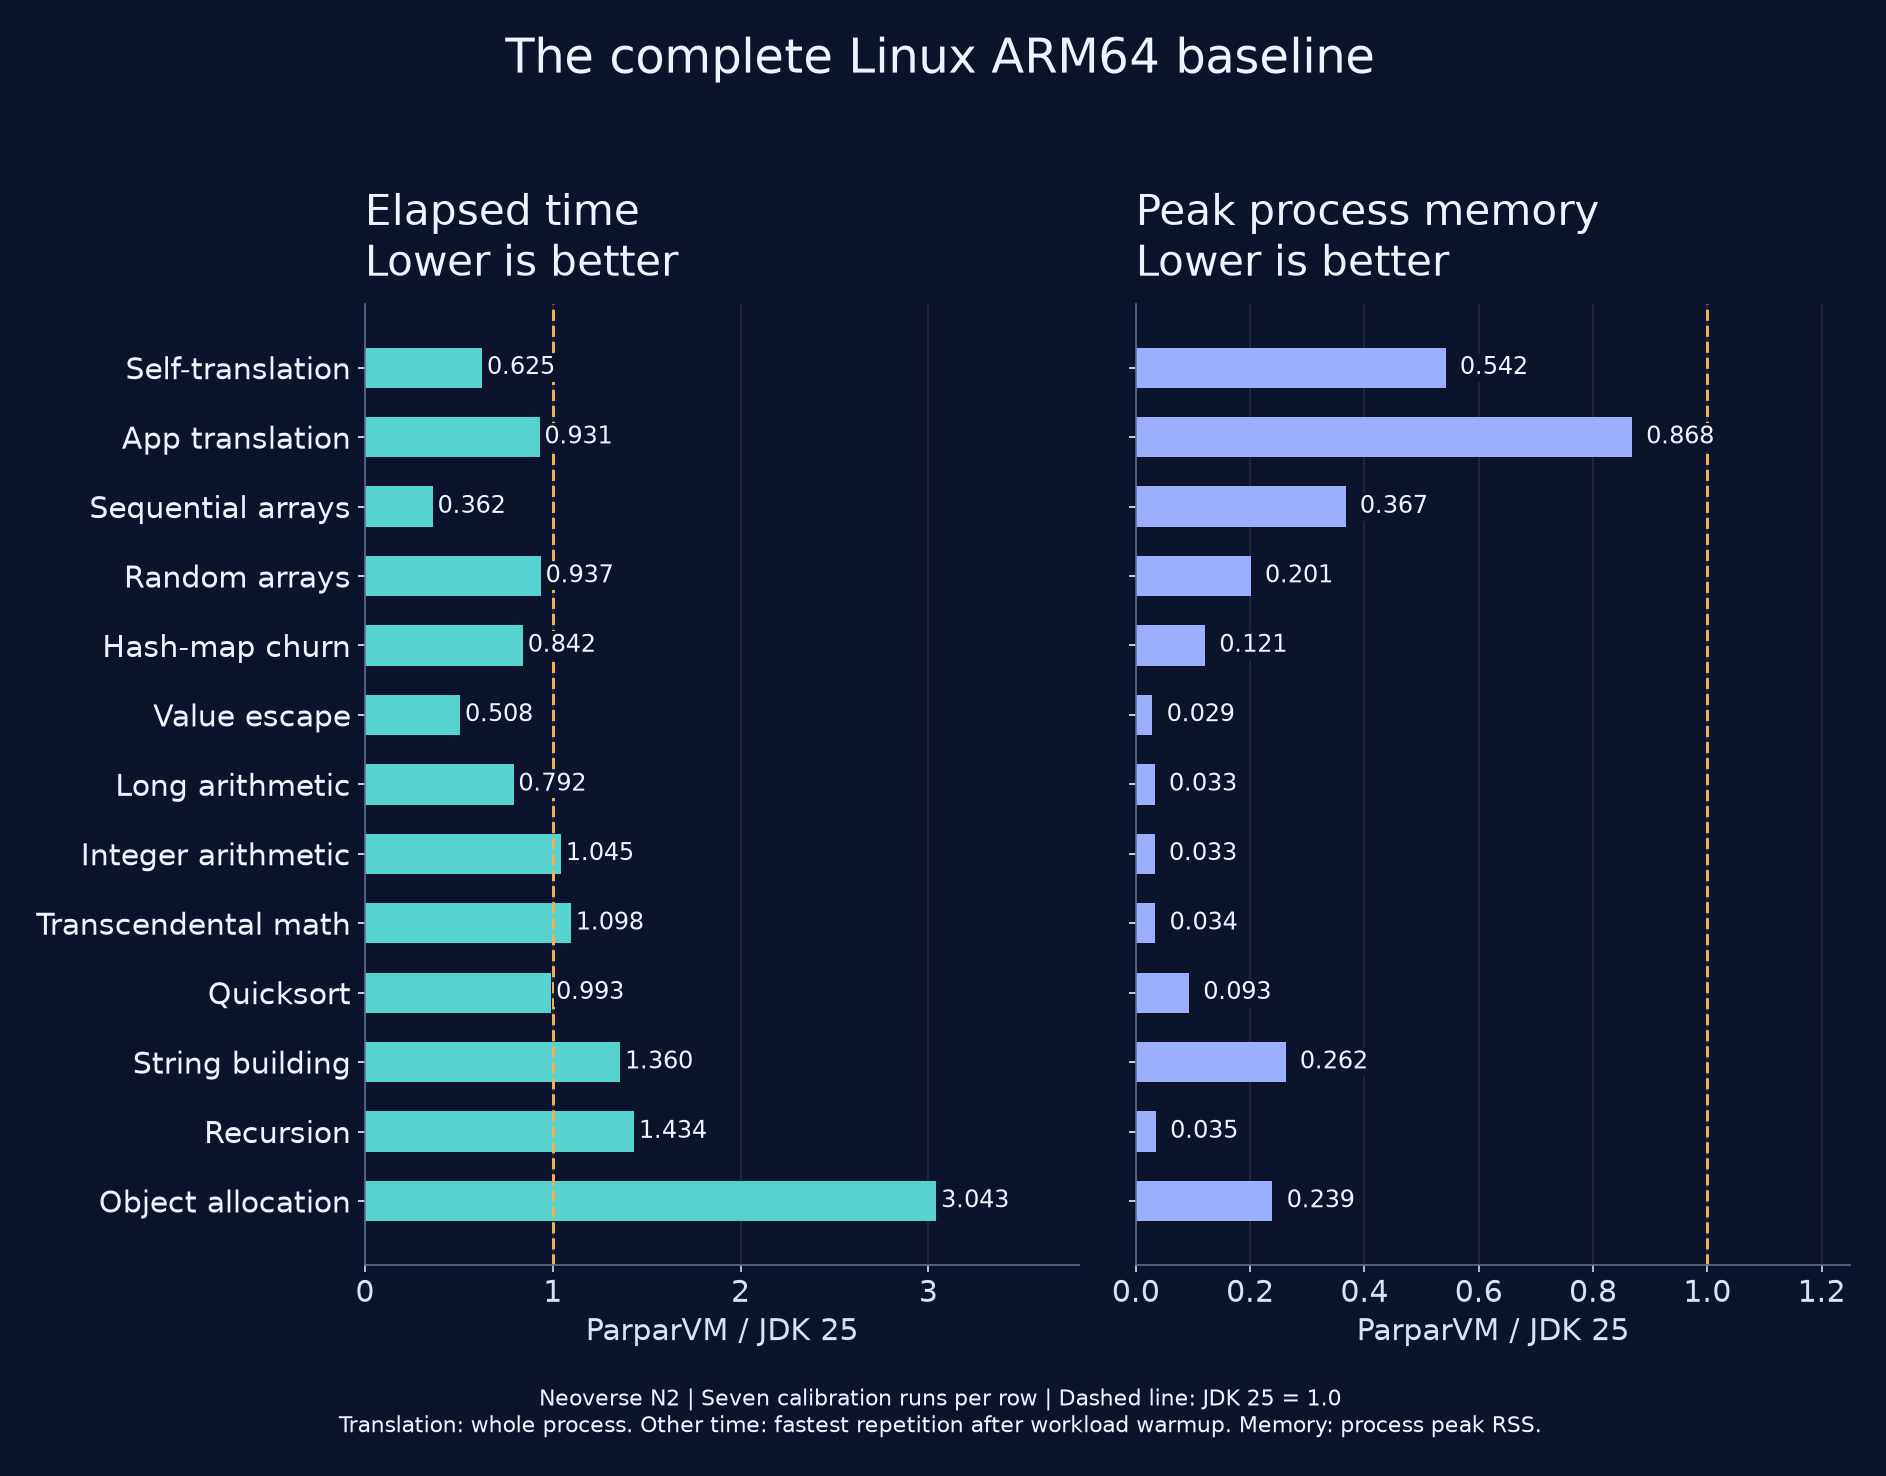
Each row combines seven calibration runs; each run compares the two runtimes in alternating order. Translation rows measure the complete process. The smaller workloads time repetitions inside the process after their own warmup, so JVM startup does not count against HotSpot. Memory is whole-process peak RSS in every row, not live heap.
The performance harness checks workload results as well as time and memory. The original self-hosting post measured 1.56 seconds for HotSpot against 1.84 seconds for ParparVM. The opening charts show the later checked-in baselines after the optimization work; they are separate measurements, not a reinterpretation of that earlier result.
Elapsed time and CPU time also answer different questions. Parallel JIT compilation and collection can reduce the wait while consuming more CPU across threads. That distinction helped guide the investigation, but it does not establish a battery saving: energy depends on the machine’s power use over time. The current baseline records elapsed time and peak memory, so those are the claims we can make from it.
Why a tiny Java object needs a header
An object header is runtime metadata stored alongside your fields. It lets the runtime identify the object’s class and track information needed for collection and other operations. On a typical 64-bit HotSpot configuration, the header occupies 12 bytes; without compressed class pointers it can occupy 16. JDK 25’s optional compact object headers reduce that to 8 bytes. Oracle’s JDK 25 GC guide documents the sizes and the -XX:+UseCompactObjectHeaders switch.
This is the work associated with Project Lilliput. Project Leyden addresses startup, warmup and footprint through ahead-of-time work, including AOT caches. The names are easy to mix up, but shrinking each object’s header and caching class-loading work solve different problems. See the Leyden project for that distinction.
| Runtime layout | Object header metadata | What the number excludes |
|---|---|---|
| HotSpot, compressed class pointers | 12 bytes | Fields, alignment and backing storage |
| HotSpot, JDK 25 compact headers enabled | 8 bytes | Fields, alignment and backing storage |
| ParparVM release layout | 4 bytes | Fields, alignment, side tables and backing storage |
These are layout sizes, not a prediction of process memory. A small HTTP server can spend more of its resident memory on stacks, code, allocator pages and library state than on live Java object headers. The server comparison measures the whole process separately.
The release object header carries a 16-bit class index, an 8-bit collection epoch and an 8-bit heap state. The class index addresses a closed-world class table instead of storing a pointer in every object. Objects requiring a legacy heap index use a side table keyed by address.
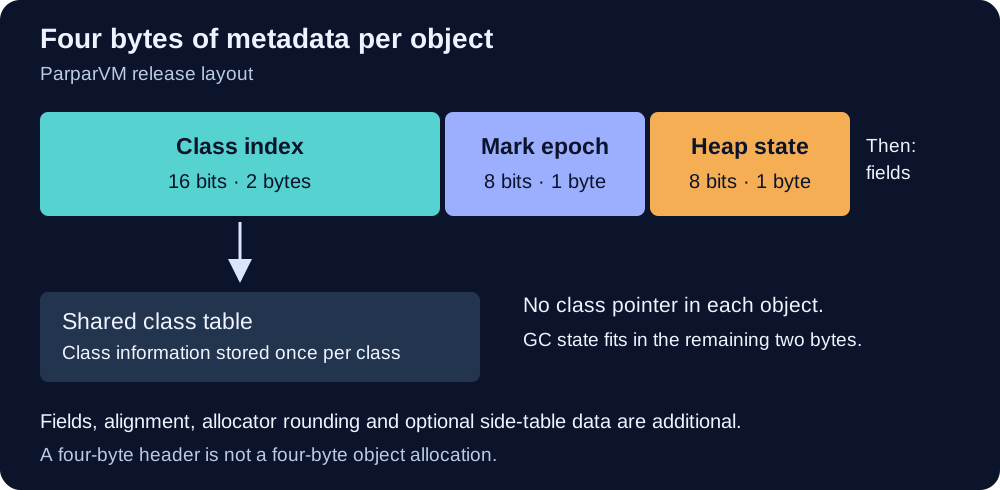
The runtime header is explicit about the distinction between metadata and allocation. The C header struct remains eight-byte aligned. Small objects live in allocator size classes, and fields need alignment too. A four-byte header does not make an empty object a four-byte allocation.
The translator packs eligible fields into the gap after the metadata. It stores fields at their real widths and orders them to reduce padding. A subclass must preserve its superclass layout as a prefix, so it cannot arbitrarily reach back and fill a hole belonging to an ancestor. That restriction sharply reduced the savings predicted by an early census.
| Object in the experiment | Before | After four-byte header and root-field packing |
|---|---|---|
VarOp | 32 bytes | 24 bytes |
ArrayList | 32 bytes | 24 bytes |
ByteCodeMethodArg | 32 bytes | 24 bytes |
BasicInstruction | 40 bytes | 32 bytes |
Object sizes from the layout experiment. Backing storage is additional.
The header-layout experiment measured one-core container RSS moving from 618 MB to 605 MB across five interleaved runs. That is useful, but much smaller than “we halved the header” might suggest. The page allocator and native collection buffers still occupy memory.
There was a second trap. A static class table that named every class also kept those classes reachable to the native linker. The current implementation registers most entries as classes are used. Shrinking object metadata should not accidentally force otherwise unused classes into the executable.
Get less overhead from the same Java loop
ParparVM translates bytecode to C. “Lowering” is the step that turns a higher-level operation into a representation the native compiler can optimize directly. We do not get that benefit merely by giving Clang a large pile of C functions.
Consider a collection traversal. The ordinary implementation has an iterator object and virtual calls for hasNext() and next(). When the translator proves the exact collection layout, it can emit a native cursor loop. When it cannot prove the receiver, it can check the exact class once and retain the ordinary iterator as a fallback.
The owner must remain a GC root until the final native-buffer access. A raw pointer into a malloc block does not keep the Java owner alive. The emitted lifetime fence is therefore part of correctness, not optional bookkeeping to strip from a fast loop.
Several related changes attack allocation and dispatch:
- Collection storage: hash tables combine key, value and metadata slices into one native allocation. Reference slices still need tracing and write barriers. Moving them outside the managed heap does not make their Java references invisible to the collector.
- Strings and builders:
StringBuilderkeeps Latin-1 bytes until it needs UTF-16. Proven temporary builders can use native storage while preserving ownership across helper calls and exceptions.StringBufferretains its synchronization. - Short string equality: bounded loads compare short strings without an ordinary Java method call. Longer ranges still use
memcmp; mixed encodings preserve their own comparison rules. The implementation must not read past the logical range just because a wide load would be convenient. - Immediate array streams: supported
Stream.of(array)pipelines with known lambda callbacks can become one C loop. Escaping streams, unknown callbacks,sorted,distinctand unsupported terminals keep the lazy implementation.
For example, this shape is eligible for the stream work when the surrounding method satisfies the proof:
long count = java.util.stream.Stream.of(names)
        .filter(name -> name.length() > 3)
        .count();
Here names is a String[]. Eligibility is narrower than “streams allocate nothing.” Nor does seeing a loop in emitted C prove that the linked binary vectorizes it. The lowering audit checks generated code and linked instructions separately from elapsed-time measurements.
Keep your program correct when removing work
A declared List type does not prove an ArrayList layout. LocalReceiverTypes tracks allocation provenance, and unknown parameters or factory results retain guards. Analysis is restricted to methods that need it, and the compiler drops the temporary frame information after capturing the proof. Optimizing the translated program should not require keeping an unnecessary analysis graph alive throughout translation.
Direct calls also gain small C intrinsics for operations such as list access, string length, hashing and builder appends. They apply to calls whose target is resolved statically, with the ordinary implementation available off the fast path. Together with traversal lowering, this lets the C compiler see useful operations inside a loop instead of opaque calls at every step.
Another pass removes instance fields the closed program never reads. It checks native-source references and conservatively keeps runtime fields and unresolved cases. Removing a dead reference field can save both its storage and the object it would otherwise retain. This pass is disabled for JavaScript output and on-device debugging.
There is a semantic edge worth stating: the current dead-field pass documents that assigning to a removed field on a null receiver no longer produces the JVM’s NullPointerException. Its treatment of an unused store is therefore not a claim of identical behavior for every Java program. An application depending on that exception needs to account for this difference.
Fit the collector to the cores you have
The small-object allocator groups objects into pages by size, often called BiBOP, short for “big bag of pages.” A nonmoving collector cannot return a page while one live object still occupies it. Free slots inside a partial page can be reusable capacity without being releasable memory.
The experiments found 50 to 60 MB of free slots inside partial pages around one peak. Those slots were reused before new pages were allocated. Calling all of that a leak would send the investigation in the wrong direction.
On one core, the generational collector can stop application work and collect young objects. With spare cores, the concurrent collector overlaps tracing with the application. The concurrent path needs grace for allocations that appear after a snapshot. That can retain dead objects longer, and shortening that lifetime requires preserving everything the snapshot could not yet see.
We tried reclaiming dead large objects every single-core cycle. The first attempts were unsound. A growing output buffer could be allocated after the extent snapshot and remain live only in a thread’s local state. If the collector could not resolve that pointer, it could free a live buffer.
The fix registers those large objects from allocation and rebuilds the relevant snapshot at each thread’s pause in that mode. The concurrent collector keeps its different grace rules. Applying one mode’s shortcut to the other added locking to a hot path without providing a benefit.
| One-core translation, five interleaved rounds | Minimum elapsed | Maximum RSS |
|---|---|---|
| JDK 25 | 13.74 s | 557 MB |
| Four-byte header before reclamation change | 10.29 s | 608 MB |
| With large-object reclamation change | 9.84 s | 503 MB |
A separate Linux container experiment isolating the reclamation change: minimum elapsed and maximum RSS from five interleaved runs. Lower is better. Its four-byte-header control peaked at 608 MB; the header-layout experiment reported 605 MB in a different set of runs. The reclamation experiment record describes this later comparison. The opening charts show the current baseline.
We then reduced work in minor collections: skip an already-old page object before expensive conservative resolution, and consult the monitor table only for pages that have had monitors. The experiment record includes the unsuccessful alternatives too. Fewer object bytes help memory use. Avoiding thousands of unnecessary collector operations helps execution time too.
What changes for your app?
If your application creates large graphs of small objects, the smaller headers and field packing can reduce their cost without a source rewrite. Proven collection traversals and stream pipelines can avoid temporary objects and dispatch. These are compiler and runtime changes, so you get them by rebuilding with a release that includes this work.
The benefit depends on what your app spends time and memory doing. A form with a large model, an importer that walks collections, and a service that allocates objects continuously stress different parts of the runtime. The allocation result above is a reason to check a busy handler before assuming it will behave like the compiler benchmark.
For an existing Codename One app, rebuild and compare a real interaction on your target device: startup, a large list or model load, and a sustained operation that creates objects. For a backend, compare resident memory at rest and under representative traffic, plus throughput and latency. Keep the input and build settings the same between releases. The backend guide covers packaging a small service you can test this way.
There is more room to improve. Our measurements point toward shorter-lived garbage in the concurrent collector and less overhead in small native collection buffers. A stop-the-world strategy saves memory on one core, but forcing it everywhere can lose too much execution time. The next step is to reduce that retention while preserving useful concurrency. That is an optimization direction, not a promise that one collector will win on every application.
Discussion
When you compare runtimes, do you record CPU time as well as the time you waited?